December 28, 2022

Looking Ahead

It's gonna be interesting, folks.

By the end of 2023 we could be as close to normal as we've been in three or four years. Most of you aren't going to like what you see. For maybe 2/3rds of us, it's going to be difficult to find new customers in the future. With rebuy rates under 40%, this means we're going to contract. It's quite possible that, if we managed a $30,000,000 business in 2019 and a $42,000,000 business in 2020 and a $39,000,000 business in 2021 and a $33,000,000 business in 2022 that we'll manage a $28,000,000 business in 2023. Factor in some inflation and you won't like that one bit. But that's where 2/3rds of us are headed.

Those who worked hard on customer acquisition as a growth tactic in 2021/2022 will be light years ahead of those of us who enjoyed all of the profit from the COVID-bump and are now looking at our situation wondering what to do next.

The near-term future is one where it is really, really hard to convince somebody who hasn't purchased from your brand to purchase from your brand. If the customer can get a comparable item on Amazon and have it delivered tomorrow, well, there's no reason for the customer to evaluate your brand. It's been like that since 2010 to some extent. It's worse today.

If you don't have a robust customer acquisition plan, one that goes beyond "spend more money with Facebook and Google", one that doesn't blame Apple (or for my catalog readers, one that doesn't blame the co-ops), you're going to have a fighting chance in 2023. If you are blaming others and saying "well, it's hard to acquire customers, not my fault" ... then it is your fault.

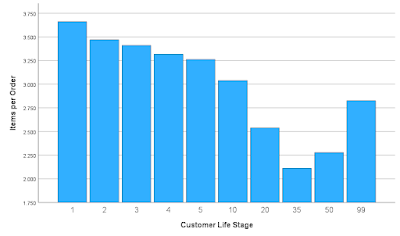
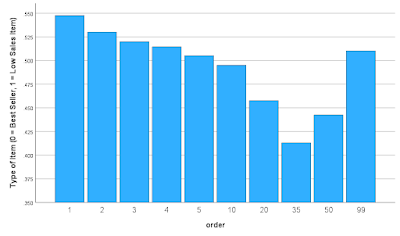
On the merchandise front, many clients are going through a dramatic transition. 2019 is the right comparison when looking at 2022.

  • 2019 = 1,000,000 customers. 1.6 orders per buyer. 2.3 items per order. $40 price per item. Sales = $147.2 million. 3,680,000 items sold.
  • 2022 = 800,000 customers. 1.65 orders per buyer. 2.2 items per order. $52 price per item. Sales =  $151.0 million. 2,904,000 items sold.

Price increases are fundamentally changing the dynamics of the businesses we run. Not everybody is experiencing this situation, but many are. We are transitioning from a customer/item fueled business to a price/margin fueled business. In the example above, we have 200,000 fewer twelve-month buyers. Guess what that does to your future?

The news isn't all bad. There's a lot of good out there. Many clients figured out how to maximize margin, or figured out how to emphasize certain items that have good margins, or figured out how to diversify the assortment to account for how customers shop at the end of 2022. Lots of innovation is happening. If you can't point to innovation at your brand, you are a year or two years behind the curve.

I think 2023 is going to be a year of "sifting through brands". Some are going to be very successful, some are going into a dark period. This is always the way it has been. By the end of 2023, we're going to be closer to what the future looks like than at any time in the past three years.

See you in 2023 ... in a few days!

December 26, 2022

Treating You Like You Are 11 Years Old

  • "Retailers: It's Time To Move Beyond Outdated Business Models".
  • "Returns Are The New Growth Strategy".
  • "Given supply chain issues, retailers should promote what they know is in stock".

That last sentence comes from Facebook. Like there is a retail professional ... anywhere ... who is gobsmacked by the thought of promoting what is in stock.

I recall attending a conference in the days before COVID - the Vendor Executive who finished a presentation walks over to me and tells me that nobody in the audience was smart enough to understand what he was presenting (he was teaching attribution).

I spent almost my entire career in retail. Yeah, there are some 40 watt bulbs out there. But you are better off assuming your audience is brilliant. If you assume your audience is dull in the squash, maybe you'll write articles and headlines that cause the audience to think you aren't terribly bright.


December 25, 2022

Merchants

Every company is run by an Executive Team ... the "C-Suite" as trade journalists like to say.

These folks, unfortunately, do not really run your company.

Your merchants, your product team, whatever you call 'em, these are the people who run your company.

It is rare to be on a Zoom call and see employees defer to somebody not responsible for the product the company sells. The marketing professional might run the call, but the merchant is the one everybody is trying to please.

The merchant is the one trade journalists have contempt for ... "The Era of the Merchant Prince is Over". It's hard for a trade journal or a research brand to make money telling you "what" to sell. It's easy for these folks to make money telling you "how" to sell stuff.

Your merchant team represents an ecosystem ... a bunch of planets or comets orbiting the sun known as your brand. Some are like Jupiter ... huge, gas-filled stormy characters that are hard to work with but deliver outsized profit levels. Some are like Venus ... get too close and you'll get burned. Others are like Mars, you want to explore them, help them, you find their work style and personality similar to you and you'll help these people any way you can. Some are like comets, you never see them until there is an "all-hands-on-deck" meeting and they fly by before heading out on an elliptical orbit into oblivion.

These folks don't always get along with "support departments", and for good reason. They don't need the Creative Team lecturing them about the "brand importance" of a product ... the merchants "are" the brand ... what they choose to sell determines what the "brand" is. I recall being in a meeting at Eddie Bauer in the late 90s when the brand marketing team changed up the creative presentation of our "winners" ... it was more "brand appropriate" as we were all told. Well, it was brand appropriate until sales cratered by about 10%. That's the point where the merchandising team stepped in and reminded everybody that something is brand appropriate when it sells at or above planned levels. The Executive Team didn't do that, the Merchandising Team did that.

These folks can be hard to work with, but you can't really blame them for being hard to work with when you realize they are the first to be fired when things go bad. I visited a client about eight years ago and presented findings ... showing everybody that the Merchandising Team made changes that hurt the company. A month later the Chief Merchandising Officer called me. He told me that because of my analysis he had been fired, and because of my analysis it was now my job to help him find a new job. I didn't get him fired, his inability to sell merchandise at levels planned for got him fired. That being said, I could certainly understand his pain. I wouldn't want to be fired because an outside consultant pointed out productivity issues.

In the UK the 26th of December is Boxing Day. Regardless where you are located, put yourself in the shoes of your merchandising team today and think about the challenges they have and how you might be able to help them.

December 22, 2022

Merry Christmas!!

For the 17th time, I wish those of you who celebrate it a Merry Christmas (yeah, that's me from a long time ago).


December 21, 2022

What Impact Did Price Increases Have On Repurchase Rates?

Yeah, I keep hearing the story ... "we had no choice but to raise prices, and now customer response is suffering".

Because each merchandise category is a "mini-brand", and because I usually look at multiple years of customer transactions, I can build a relationship showing how rebuy rates within a brand change as prices increase/decrease.

Here is the relationship for one brand.


That's just a beautiful image!

The relationship above explains 38% of the reason why rebuy rates declined as prices increased. Here is the equation:

  • Change in Rebuy Rate = 2.521 - 1.457*(Change in Average Price per Item Purchased).
Let's evaluate an example. Assume that prices increased by 10%.
  • Change in Rebuy Rate = 2.521 - 1.457*(1.10).
  • Change in Rebuy Rate = 0.9183.

In other words, if you increase prices by 10%, you lower rebuy rates by 8%.

You probably want to understand this relationship, correct?

December 20, 2022

They're Giving Discounts To Which Customer Segment?

You don't always get honest answers when asking questions about discounting strategy.

Here is a "grid" for one category, with corporate orders on the y-axis and category orders on the x-axis. The metrics in the table represent the share of sales that are generated by items selling below their historical average price point. Tell me what you observe:


The upper-left cell is for customers who are placing their first order with the brand and in that order the purchase at least one item from the category being studied. 40.3% of the sales meeting this criteria feature items selling below their historical average.

Meanwhile, the lower-right cell is for customers who are placing their 21st+ order with the brand and are buying from the category for the 11th+ time ... the most loyal of loyal buyers. 25.5% of their sales feature items selling below their historical average.

This brand has a clear strategy within this category ... they are offering discounts to entice prospects to purchase for the first time.

Is that a smart strategy? Maybe. If the customer can be enticed into buying via full price yielding nice gross margins, the downstream math could work out.


December 19, 2022

Share of Items Sold Below Average Historical Price Point

Let's look at the data by merchandise class.


This brand just quit discounting, didn't they? That's how they are dealing with price increases. Let's compare 2022 to 2021 by merchandise class.

  • 33.5% of old items were discounted last year, 20.3% this year.
  • 48.4% of 3yrs ago items were discounted last year, 28.8% this year.
  • 48.4% of 2yrs ago items were discounted last year, 30.2% this year.
  • 38.4% of 1yr ago items were discounted last year, 36.4% this year (not as big a change).
You can either raise prices, or you can discount less, in an effort to increase gross margin percentages. Of course, either strategy results in lower response. It's a huge game of wack-a-mole, one that is terribly hard to win at.


December 18, 2022

How This Company Is Managing Price Increases

When you look at the average price per item purchased by merchandise class, you see interesting things. Look at this brand:

This table is full of interesting findings. Look at old items. Old items are considerably cheaper in 2022 than are items from other classes ... though prices have generally increased on the items that remain.

Look at the diagonal ... the cells represent the price of items introduced that year. In 2020 new items averaged $30.11 ... in 2021 new items averaged $38.04 ... in 2022 new items averaged $45.29. Each year new items are introduced at ever-higher prices.

Read across each row ... this brand increases prices on the items that remain as time passes, or the brand discontinues low-priced items.

This dynamic creates all sorts of odd customer-based outcomes. Customers looking for lower prices either wait for discounts/promotions, or customers gravitate to items that are cheaper (i.e. the older items). These dynamics make new items appear unattractive according to company reporting, pushing continuance of older items, which hurts the future of the brand.

These dynamics are happening everywhere in late 2022, and the dynamics are problematic.


December 15, 2022

Price Point Resistance

In an inflationary environment, your newer customers are more tolerant of higher prices than are your long-time customers. Here's an example from recent work:

  • $36.29 average price point for customers acquired 49+ months ago.
  • $38.58 average price point for customers acquired 37-48 months ago.
  • $39.19 average price point for customers acquired 25-36 months ago.
  • $39.09 average price point for customers acquired 13-24 months ago.
  • $42.10 average price point for customers acquired 0-12 months ago.
This brand generates 40% of sales from customers acquired 49+ months ago. That's a problem for this brand, because this brand is trying hard to increase prices to cover cost of goods sold increases ... but the long-term customer base is balking at price increases.

If 15% of your sales come from customers acquired 49+ months ago, it will be easier to pass along higher prices to customers.

It's common to observe price resistance among long-term customers.

December 14, 2022

Discounting by Merchandise Class

Here's a fun one for a merchandise category recently analyzed. The metrics below show the percentage of sales attributed to items selling below their historical average price point.

  • 31% for this year's merchandise class.
  • 36% for last year's merchandise class.
  • 30% for merchandise class from two years ago.
  • 29% for merchandise class from three years ago.
  • 20% for merchandise class from 4+ years ago.

This data is interesting. Items being sold from merchandise classes 4+ years ago are not being discounted. Items from the class two years ago are being discounted the most.

The stuff that is still selling from 4+ years ago tends to be best items, and therefore those items do not need to be discounted, do they? 

In my work, it is common to see one (1) merchandise class discounted more than other classes. You've been there, you know why this happens ... there are cases where a merchant is fired, and the new merchant just doesn't like what the prior merchant sold. Consequently, the prior merchant's items are discounted ... get rid of 'em!

Of course, there is a customer aspect to this dynamic. As a brand clears out of a merchandise class, the brand creates a customer who wants to buy the merchandise being cleared out, and wants to buy that merchandise at a discount. What happens to the customer who buys merchandise being cleared out at a low price? Often, that customer becomes less responsive.

December 13, 2022

Merchandise Category: Customer Composition

Have you ever looked at "how" a merchandise category generates customers? It's fun stuff!

Let's evaluate a category.

  • Last Year's Buyers = 21,315.
  • Rebuy Rate This Year = 6.5%.
  • Existing Buyers Repurchasing = 1,386.

The merchant might believe that his/her customers are loyal. They are not loyal. Nope.


How about all of the other customers who bought from the brand last year but did not buy from this category?
  • Last Year's Buyers = 669,200.
  • Rebuy Rate This Year = 0.85%.
  • Brand Buyers Repurchasing = 5,696.

Almost none of the brand buyers from last year (but no category purchase) decided to purchase from the category this year. Seriously ... it's less than 1%. And yet ... more than 4x as many customers came from this segment as came from existing category buyers repurchasing from the category. In other words, it's important for this category to generate success from last year's brand buyers who did not buy from the category.


How many customers were new/reactivated and bought from this category?
  • 6,701.

Let's summarize the three segments.
  • 1,386 buyers were existing category buyers purchasing from the category again.
  • 5,696 buyers were existing brand buyers purchasing from the category.
  • 6,701 buyers were new/reactivated to the brand, in total, and bought from the category.

This category is fully dependent upon new/reactivated buyers and from brand buyers who did not buy from the category in the past year. As are most categories, to be honest.


Know these facts, and guide your category marketing approach appropriately.

December 12, 2022

Category Development: Product Offering

In the next four(ish) weeks, I will launch a new product called "Hillstrom's Category Development". The product will build upon Customer Development work from 2021, looking at your merchandise/product categories as mini-businesses within your brand ecosystem.

Each "mini-business" has different pricing levels (and price increases or decreases) that help us understand what role pricing has had on customer response.


In the example above a 10% price increase results in an 8% drop in rebuy rates. A Category Development project helps us see the impact on rebuy rates, spend per repurchaser, new/reactivated buyers, and gross margin dollars.

Customers buy merchandise, and merchandise belongs to categories. Given equal attributes, we commonly see that buying from more categories leads to more future value.'


The table shows many cases where you'd rather have a customer buy fewer items from more categories than many items from one category. This trend happens often across my client base, and can be accelerated via email personalization (for instance).

Each category delivers new customers at varying levels ... some categories are good at this, some are not. Subsequent, some categories deliver high-value customers, while other categories deliver duds.


A Category Development project focuses on discounting/promotions. For some clients, discounts/promotions yield more profit in the long-term via development of "more" customers who generate "less" profit in the future ... if the "more" more-than-offsets the "less", you're good. In a recent project, I measured future gross margin dollars.

  • Each dollar spent on full-priced merchandise last year = $0.19 gross margin this year.
  • Each dollar spent on discounted merchandise last year = $0.16 gross margin this year.

That's a case where discounting hurts the future. There are cases where discounting helps the future. A Category Development project looks into this issue and provides answers.

A Category Development project illustrates changes over time. One category is the same size today as it was in Summer 2020, contracting after the COVID-bump. However, the category is fundamentally changed.
  • Annual Items Sold Today = 104,193.
  • Annual Items Sold 6/30/2020 = 124,568.
  • Price per Item Purchased Today = $57.44.
  • Price per Item Purchased 6/30/2022 = $47.70.

Yeah, units equal customers, and for this category they are trading customers to generate margin dollars at a higher price per item purchased.
  • % of Sales Sold Below Historical Average Price Point, Today = 29%.
  • % of Sales Sold Below Historical Average Price Point, 6/30/2022 = 32%.
  • % of Sales from New Items, Today = 6.8%.
  • % of Sales from New Items, 6/30/2022 = 7.6%.
  • Gross Margin % Today = 44%.
  • Gross Margin % 6/30/2022 = 39%.

We see minimal changes in discounting and new item development. We see a big jump in gross margin percent. How about gross margin dollars?
  • Gross Margin Dollars Today = $2,642,656.
  • Gross Margin Dollars 6/30/2022 = $2,340,423.

We see the tradeoffs ... customer response (via units sold) is dampened at higher prices. However, gross margin dollars increased. The company is more profitable, with fewer customers, which will impact future sales.

These are the kind of tradeoffs analyzed in a Category Development project.


As you know, when I am introducing a new product, I introduce it at a lower price for my clients and for blog subscribers. I test the code, to make sure that everything is working properly. You get comparable results to a full project, but at a significantly lower rate.

Pricing for Category Development:
  • $30,000 will be the full project cost when the product is launched.
  • $14,000 will be your price for participating in this test.
  • If you pre-pay to spend your budget prior to year-end, I'll do the work for $11,500.

Take advantage of this opportunity, given that I don't discount my prices ... I only offer opportunities like this when testing the code of a new product.

Contact me now ... kevinh@minethatdata.com!!


Loyal Buyers Are Different

There are a lot of things you have to be careful about when evaluating loyal buyers vs. new buyers. Price and merchandise category data help shape your thought process.

Let's look at a handful of metrics, comparing first-time buyers vs. loyal buyers.


AOV, Items, Price.
  • Loyal Buyers = $123, 4.3 items, $28.92 price per item.
  • New Buyers = $106, 2.5 items, $42.67 price per item.

Already our brains should start clicking. Why would new customers purchase a small number of expensive items while loyal buyers purchase many inexpensive items? By the way, this trends happens frequently in the data I analyze.


% of Sales Spent on Items Selling Below Their Historical Average.
  • Loyal Buyers = 30%.
  • New Buyers = 25%.

Looks to me like this brand prefers to offer discounts/promotions/incentives for loyal buyers, doesn't it?


% of Sales Spent on New Items (new in the past year).
  • Loyal Buyers = 20%.
  • New Buyers = 13%.

This is also common. Sometimes traditional catalog brands feature long-term best-selling items to new customers. Sometimes Google has a lot of history with long-term best-selling items, steering traffic accordingly.


% of Sales From Category 6.
  • Loyal Buyers = 17%.
  • New Buyers = 7%.

You will find 2-3 categories that clearly skew to new buyers, and you will find 2-3 categories preferred by your loyal customer base. Be careful here!!!! Don't make the mistake of assuming that because one segment of customers likes a subset of your assortment that all customers will like your assortment ... that's just not how this stuff works in reality.


% of Sales Submitted via Call Center.
  • Loyal Buyers = 31%.
  • New Buyers = 14%.

This is a classic (and dangerous) situation. This is the signature of a classic catalog brand that is battling the past while trying to move into the future. When loyal buyers do "old school things", it's hard to move into the future. When your new customers do "modern things", your instinct as a brand will be to shove "old school things" at customers who want to do "modern things". You'll see this in modern e-commerce as well ... compare mobile vs. desktop.


Your loyal buyers are different. Analyze the differences, and then personalize "how" you treat loyal buyers. You can have one merchandise assortment, but you can also "feature" the stuff that loyal buyers like (and do the same thing for your prospects).

December 11, 2022

A Category Making Progress

Over time I've changed how I evaluate winning items.

In the past year, I've analyzed items sold on a daily basis. Each day is analyzed separately. If a bad item is featured in an email campaign, the item may well be a winner for a day or two. May as well credit the item as a winning item for that day or two, correct?

I rank-order all items during the course of a day, then cumm total sales. If the best selling item represents 10% of sales that day, that item is assigned a value of 0.10 for that day. If a lousy item sold 1% of total sales and was in the 74% percentile, the lousy item is assigned a value of 0.74.

Each item is coded separately, each day.

There's a thousand things I can do with this data.

For one category, I analyzed the percentage of sales on an annual basis for top 20% of items, 21% to 40% of items, 41% to 60% of items, 61% to 80% of items, and 81% to 100% of items. Here's the table.


This category doesn't have a lot of best sellers - if it did, 20% or more of annual sales would be from items in the top 20%.

However, this category is changing. Look at the 41% to 60% column - average selling items. The fraction of sales have increased each of the past three years ... from 17.2% to 18.8% to 20.7% to 22.0%. Same thing with items in the 61st to 80th percentile. Meanwhile, items selling in the bottom 20% of the sales distribution used to comprise 40% of sales (three years ago) but only comprise 34.2% today.

The merchant in charge of this category is doing something right - the results are not dramatic, but there is clear improvement here. Good job!


December 08, 2022

Price is Not the Entire Story Here

We studied one category yesterday. Here is the relationship between change in price and change in total margin dollars, by category. Tell me what you observe?


This is very interesting.

Where does the curve peak? Right around a change in price of 1.3.

In other words, margin dollars were maximized at around a 30% increase in price.

Whaaaaaaa?

Now look at the y-axis. Margin dollars peak at a 30% increase in price, however, margin dollars peak at about 0.92 ... an 8% margin dollar decrease vs. last year.

What does this mean?

It means that something else is going on that caused the business to fall apart. In this case, I know the answer ... this brand cut WAY BACK on marketing dollars targeting customer acquisition prospects. By cutting back on marketing spend, the business had no way to achieve optimal gross margin dollars (though the business might achieve optimal profit dollars).

But the price increases aren't, for the most part, limiting gross margin effectiveness.


December 07, 2022

Prices Going Up

Here's one of the things I keep seeing in 2021-2022. Look at annual sales for this one specific category.

  • $2.1 million in past year.
  • $2.5 million a year ago.
  • $3.0 million two years ago.
  • $2.7 million three years ago.
So, yeah, you can see the COVID-bump from two years ago. But in the past year sales declined by more than 10%. That's probably not COVID-bump related.

Here are price per item purchased metrics for the past four years.
  • $31.53 in the past year.
  • $24.94 a year ago.
  • $22.79 two years ago.
  • $22.40 three years ago.
Well, prices are up ... way ... way ... up.

Let's look at gross margin percentage.
  • 53.8% in the past year.
  • 49.6% a year ago.
  • 48.1% two years ago.
  • 48.9% three years ago.
Those figures make it look like prices were increased faster than cost of goods increased.

Let's look at sales from items selling at/above their historical average price point.
  • $1.8 million in the past year.
  • $1.8 million a year ago.
  • $1.8 million two years ago.
  • $1.5 million three years ago.
So, items selling at/above their historical average price point continue to generate comparable levels of revenue. This means items selling below their historical average price point are in severe decline.
  • $0.3 million in the past year.
  • $0.7 million a year ago.
  • $1.2 million two years ago.
  • $1.2 million three years ago.
This may not be an issue of raising prices ... instead, it looks like an issue of not discounting anymore. By not discounting, the brand "appears" to have increased prices, and the perceived increase in prices results in a sales hit.

What happened to total gross margin dollars generated?
  • $1.1 million in the past year.
  • $1.2 million a year ago.
  • $1.4 million two years ago.
  • $1.3 million three years ago.
The differential in price (this year vs. last year) resulted in fewer gross margin dollars.

This is the story for one category. You need to look at all categories, of course.

December 06, 2022

Category Analysis

Our past-lockdown inflationary period has illustrated to me the importance of analyzing merchandise categories.

Thirty years ago, your direct marketing team carefully studied the performance of key items, of spreads of items (in paper catalogs), seeking to understand why marketing activities performed well (or performed poorly). Turns out that big gains (or big challenges) were seldom the responsibility of the marketing department. Instead, the business thrived or failed because of what was being sold, at the price it was being sold at.

A decade ago I took a shot at understanding the role merchandise played in the health of a business (I called this "merchandise forensics").

Today I need to revisit the topic, but come at it from a different angle. I receive so many questions about the impact of inflation on customer loyalty and customer acquisition. It is hard to measure the impact of price changes on your customer file when looking at the business as one big homogenous brand. But if you divide the business into pieces, into merchandise categories, you learn that each of these "mini-businesses" have their own dynamics. Some categories experience price increases, others do not. Some categories greatly expand new products, others focus on tried-and-true winners.

This diversity of "mini-businesses" helps us understand what is driving a business and what is holding a business back.

You undoubtedly have many merchandise categories, and if you optimize category performance, you have a diversity of behavior worthy of analysis.

So, tomorrow, we begin our study of merchandise categories. Email me if you would like your business analyzed (kevinh@minethatdata.com).

December 05, 2022

Spotify Wrapped

How hard is it for you to replicate what Spotify does with Spotify Wrapped?


I mean, you have loyal customers. Why not regale them with everything they purchased during 2022? Make it fun - classify the customers based on their behaviors (Spotify calls me a "connoisseur" ... and surprisingly, they say I listened to Ariana Grande more than any other artist, which is dumbfounding to me but has to be true).

You have the data.

You have creative staffers to help you.

Why not emulate Spotify?


December 04, 2022

Deion Sanders

If you watched football in the 90s, you knew who Deion Sanders was

If you follow college football in the 20s, you know who Deion Sanders is ... the wildly successful coach of Jackson State, and the newly appointed head coach at Colorado.

Now, watch this video ... this is his first seven minutes with his new team at Colorado (click here).

Name one person who promotes the omnichannel thesis in retail, or who promotes catalog marketing ... name one ... who has this level of passion? Name one. I'll wait for your answer.

Is he going to be successful? Who knows?

But he cares.

And nobody, and I mean nobody in our industry, has this level of passion.

We wonder why our industry is a cold, tepid place where we think we're doing good work when we pay Google/Facebook money?

If you find somebody in this industry who cares like he does, follow that person.

Longer-Term Impact of Discounting Today

Now that you have recovered from the magic, the pageantry, the thrill of Cyber Monday, you might want to take a look at how you changed your business going forward ... well, more specifically, how you altered future customer behavior.

I posted this information on LinkedIn last week ... when I post it on Twitter I get the typical professional with 22,493 tweets and 94 followers telling me I'm a moron ... but at least on LinkedIn folks understand the nuances of business. I ran a model last week, predicting future spend on full-priced items and on discounted items, based on purchase history of full price and discounted items.

Assume we have a customer who spent $100 on full-priced items in the past, and spends $100 on Cyber Monday on full priced merchandise. In the next twelve months, the customer will spend:

  • $62.50 on full-priced items.
  • $13.60 on discounted/promoted items.
  • $76.10 total spend.
  • $45.32 future gross margin dollars (59.6%).

Now let's assume that the customer who spent $100 on full-priced items in the past spends $100 on Cyber Monday on discounted/promoted items. In the next twelve months, the customer will spend:
  • $52.80 on full-priced items.
  • $20.50 on discounted/promoted items.
  • $73.30 total spend.
  • $42.02 future gross margin dollars (57.3%).

In the future, the customer bends future dollars away from full-priced items, toward discounted/promoted items. The customer generates less profit (gross margin dollars) in the future because of behavior in the past.

Your mileage will vary?

What does the data look like for a customer with $0 full-price and $200 discounted/promoted?
  • $43.10 on full-priced items.
  • $27.40 on discounted/promoted items.
  • $70.50 total spend.
  • $38.72 future gross margin dollars (54.9%).

The more you discount/promote today, the more you bend future behavior toward discounting/promotions.

Now, I get it ... there are times you have to run promotions, or want to run promotions, or you have to liquidate merchandise.

But you don't have to do what trade journalists demand of you (40% off on Cyber Monday or 50% off on Black Friday). You just don't have to follow the industry narrative.

Do what is right for your customer, and for your business.

December 01, 2022

Items per Order

Take a look at this graph.


As the customer becomes more loyal, the customer (not shown here) orders more often. However ... however ... as the customer becomes more loyal and orders more often, the customer purchases fewer items per order.

Let's see what happens to price per item purchased.


Oh oh.

This is a signature of a brand that demands that best customers buy frequently. The company gives the customer incentives to purchase ... so the customer purchases more often, but backs off on how much the customer is willing to spend.

Loyalty advocates manage businesses that possess customer attributes similar to what we've observed this week. They discount like crazy to best customers, they get customers to buy more often, but customers purchase fewer items at a comparable price. Loyal customers are making tradeoffs ... all the time. You think you are doing good work. The customer adjusts.


November 30, 2022

Winning Items? Or Other Items?

Look at the bar chart below.


A first-time buyer buys a mix of items, no doubt, but the items marginally skew toward "anything", meaning that the items are not skewed to best sellers (those items have a value of 0.00 in this analysis ... low-selling items have a value of 1.00 in this analysis).

Outside of the crazy customers who buy all the time (often employees), loyal customers tend to skew to best-selling items, in this case.

Every company has a personality ... this company gives discounts to best customers, and best customers appear to buy winning / best selling items. One might surmise that this company is discounting best-sellers to loyal buyers.

A common trap clients fall into is the trap where loyal customers like long-term best-selling items, thereby paralyzing the brand when a merchant wants to move the brand forward with new items not guaranteed to sell well. When best customers like best items (which have been sold for a long time), the brand cannot move forward ... customers will hold the brand hostage.


November 29, 2022

Life Stage Data

Some of the most enjoyable work I perform surrounds the life stage the customer is in.

In the bar chart below, we evaluate customers after a 1st / 2nd / 3rd / ... / 51st+ order. Within that order within the life stage, the chart evaluates the percentage of the amount spent that was on items selling below their historical average price point.


For this brand, what does the data suggest?

It suggests that the brand discounts heavily to best customers. Less than 25% of sales from first-time buyers is discounted ... after ten purchases, more than 40% of sales are discounted.

Every company has a personality - what the company believes in is revealed through the data sent to me. This company cares about loyal buyers.


November 28, 2022

Chicken Efficiency

Via Twitter user , we are introduced to the concept of "Chicken Efficiency". This is one of the best stories I've read all year. Read the text in the image below to the end.


Chicken Efficiency! 

You'll hear about the amazing Cyber Monday that "brands" had all day today. Realize that research professionals, vendors, trade journalists, and pundits are measuring Chicken Efficiency. 

You, however, are measuring profitability. Which is why you do not care about Cyber Monday.


November 27, 2022

Cyber Monday

It's the day that trade journalists and vendors praise companies for selling a $50 item that costs the brand $25 for just $30. They smugly suggest that all of the additional "traffic" will make up for the $20 of gross margin dollars you give up to make a theoretical "consumer" happy.

a) Selling a $50 item that costs you $25 gives you $25 of gross margin.

b) Selling a $30 item that costs you $25 (40% off, woo-hoo) gives you $5 of gross margin, requiring 5x the traffic converting at the same rate for you to make the same amount of profit.


I've told you this story before ... but it symbolizes Cyber Monday. I'm sitting in an Executive Meeting (as a consultant) at 8:00am on Cyber Monday. An employee walks into the room, hands the CEO a folded piece of paper. The CEO opens the folded piece of paper in a manner not unlike a 16 year old boy would in high school chemistry after having the paper passed across six desks from a girl named Becky, reads the contents, looks up, and then pauses the meeting. He addresses the room.

"Brand X just announced they are at 50% off today. Fifty percent! We're only at 40% off. If we want to remain competitive, we need to be at 50% off today as well. Charlie (the marketing executive), tell you team to redo the creative on the 9am blast and switch to 50% off. Have them create a new discount code and get that code on the website as soon as possible." Charlie, the CMO, headed out of the room with a look on his face like his scrambled eggs for breakfast weren't fully cooked and his tummy was just realizing that fact.

Humans.

Here is a chart from a company that doesn't even care all that much about Cyber Monday. We look at percentage of sales that day that come from items selling below their historical average price point. Tell me what you see.


Yeah, for one day they just gave some merch away in an effort to please, well, um, I have no idea who they were trying to please. By the way, if you average sales for the Monday before Cyber Monday and for the Monday after Cyber Monday, you learn (for this brand) that sales did not increase on Cyber Monday. Prices were lower, profit was lower, sales were identical.

Notice the heavy discounting in the week prior to Christmas. This company switches into "liquidation mode" and starts moving out winter stuff in anticipation of Spring/January.

In mid-November, the brand begins to discount more. The brand discounts even more on Cyber Monday, then reverts back to pre-Cyber-Monday behavior, before clearing out stuff in late December.

What does the graph depicted above look like for your brand?

November 24, 2022

Which Customer/Product Combination Yields The Best Gross Margin Percentage?

Back to our table format studied this week. This time, each product / customer combination measures gross margin percentage.

The green cells represent the highest gross margin percentages.

Do the best selling items have the highest gross margin percentages?

No.

Do the best customers have the highest gross margin percentages?

No.

If you think your best customers and your best products should yield the highest gross margin percentages, trust your instincts.

This business isn't being optimized properly.

Have you run this table for your brand?

No?

The contact me (kevinh@minethatdata.com) and let's get busy.


November 22, 2022

New Items Are Not Best Items

Back to the table framework we've been studying this week, take a look at share of sales from new items by product decile and customer decile.

Two things are worth pointing out in this table. First, new items are seldom best-sellers. New items require patience ... they need to be developed (just like customers need to be developed). Second, there are interesting trends in the table. The best customers are less likely to buy new items than are other customers. We teach our best customers what they should purchase, and guess what? They purchase what we tell them to purchase!

The second point is an important one. If our merchandising/product teams want to sell something different, our best customers frequently say "no" ... the best customers hold back brands looking to change. This is why, so often, it is best to launch a whole new brand than it is to try to transform a brand from within. Best customers simply don't want to change.


November 21, 2022

This Happens A Lot!

I see this one a lot ... look at the New/Reactivated row, and compare the price these customers pay for merchandise compared to the best customers.

Among the best selling items (the 5% column), best customers paid an average of $62.43 per item, whereas new/reactivated customers spent $71.96. This difference isn't as extreme through the remainder of columns, but the difference exists.

This happens A LOT in my project work. Either best customers are being given deals/discounts (whereas new/reactivated buyers are frequently given free shipping), or the merchandise preference is slightly different. Given that I'm controlling for the sales potential of the items in this table, it's a discounting issue. 

Sometimes my clients wonder why it is so hard to acquire customers? Sometimes it's hard because you're asking new/reactivated buyers to pay 10% more per item than your loyal customer base is asked to pay. 


November 20, 2022

Project Opportunity

I am in the process of finalizing a project package around discounts/promotions/pricing.

As is usually the case, I offer a significantly discounted project opportunity for loyal blog readers as I finalize the project code and test usability of the concept.

For you, that means I am offering two (2) readers the opportunity to purchase the discount/promo product (you've been reading about elements of what this project will become) for just $12,000 (it will be a $24,900 project when it is officially released).

Contact me immediately (kevinh@minethatdata.com), because both spots will be gone shortly.

November 17, 2022

Where Are The Discounts Being Applied?

Sometimes discounts/promotions are applied to items via liquidation efforts. This is one of those cases.

In this table, each row represents a group of customers. Best customers are at the top of the table (5% = best decile of customers, 15% = next best decile of customers). New/Reactivated buyers are at the bottom of the table. Meanwhile, item sales are rank-ordered across the top of the table. The best items are in the 5% column, the worst-selling items are in the 95% column.

Which cells (red) represent customers buying discounted products? The columns at the far right side of the table tell the story ... the worst-selling items are selling at/above their historical average price point about 70% to 75% of the time. The best-selling items sell at/above their historical average about 85% of the time.

So we have two dimensions at play ... marketers are offering discounts/promotions, no doubt about it. But at the same time, the merchants are liquidating lousy products. Both parties contribute to the challenge ... as is generally the case.


November 16, 2022

Optimal Price / Discounting Ratio

Ok, this isn't optimal because I'm not looking at gross margin dollars (that's reserved for clients), but you'll get the idea here about what I'm looking to accomplish.

I created regression models that predict the impact of prices on rebuy rates, and another model that predicts the impact of discounting on rebuy rates (again, gross margin work is done for clients).


The average price point for this category was $50.00, and the average percentage of items sold at/above the historical average price point was 75%. This yielded a 51.6% rebuy rate.

What happens if prices increase to $55.00 and discounting remains constant?  Rebuy rates decrease to 49.7%.

What happens if prices increase to $55.00 and discounting increases so that just 56.3% of the items are selling at/above their historical average price point?  Rebuy rates maintain at 51.5%.

This dynamic is coming to an omnichannel brand near you (your mileage will vary). Prices increased a year ago and continue to increase, customers balk at higher prices and purchase less often, leading "brands" to discount more to maintain response (which means that gross margin dollars decrease and the brand is less profitable).

It's hard to fight the customer. The customer is telling us how much s/he is willing to spend, and the customer does not care one bit, one bit, about how our cost-of-goods increased. Many of us are going to give up profitability, either by increasing prices / decreasing response, or by increasing prices / discounting (which decreases gross margin dollars).


November 15, 2022

Sometimes Discounting Leads To Positive Results

The secret to discounting is to generate more gross margin dollars and build a stronger customer file (for some, it is to liquidate merchandise, but that is a topic for another day). The goal should never be to steal market share, because honestly you'd have to be a ten billion dollar brand (or larger) for that to even make the slightest difference.

So, if you choose to sell a $50 item with a $20 cost of goods for $35 via your promotional/discounting program, you must sell twice as many units to equalize gross margin erosion.

I worked with a smart brand who knew what this relationship looked like, and they discounted only enough to make the math work (or, in this case, come very close to working). In their case, I created regression models that predicted how much customers would spend next year on items selling at/above their historical average price point, how much customers would spend next year on items selling below their historical average price point, and how much gross margin dollars customers would generate next year.

For customers who spent $100 on items at/above their historical average price point and spent $0 on items below their historical average price point ...

  • $64.41 spent next year on items at/above the historical average price point.
  • $8.44 spent next year on items selling below their historical average price point.
  • $73.05 spent next year, total.
  • $45.37 gross margin dollars generated next year.
  • 62.1% future gross margin.

For customers who spent $0 on items at/above their historical average price point and spent $100 on items below their historical average price point (discount-centric customers):

  • $56.51 spent next year on items at/above the historical average price point.
  • $28.74 spent next year on items selling below their historical average price point.
  • $85.25 spent next year, total.
  • $44.27 gross margin dollars generated next year.
  • 51.9% future gross margin.

This company comes really, really close to getting the math right. Full price customers generate $73.05 next year while discount-centric customers generate $85.25 next year. Discounting led to customers who spent 16.7% more in the next twelve months. However, full-price customers generate a 62% gross margin next year while discount-centric customers generate a 52% gross margin next year. Full-price customers generate one extra dollar of gross margin in the next year.


This is one way to make discounting work. As long as gross margin dollars are equal/greater and as long as the customer file is stronger, the math "can" work. I have a responsibility to share this fact with you.


But you have to do the math, perform the analysis, and understand the tradeoffs. At minimum you have to take the math down to future gross margin dollars. In a smarter world, you'd include pick/pack/ship information as well, and take into account any additional p&l metrics that matter.

November 14, 2022

By Year of Introduction

This example is from the pre-COVID era ... and the example didn't turn out the way I expected it to turn out.

When I looked at the percentage of sales at/above the historical average price point for an item by year of item introduction, I expected the brand to discount items more and more as the item aged. I didn't expect this:

Some of the trends make sense to me. Newly introduced items (look at 2016 / 2017 / 2018) are more likely to sell at full price than are older items. This happens all the time ... older items are discontinued and are consequently discounted.

2019 looks different - you can see that this brand made a solid effort of re-establishing price integrity after several years of discounting.

As many of you are experiencing in 2022 ... when prices go up (either due to the end of discounting or because of cost of goods sold increases), response goes down. That's how this stuff works. Eventually, you land on a local maxima where pricing is theoretically optimized ... until it isn't once again.


What Happens At Different Life Stages?

One of the first analyses I run in a Merchandise Dynamics project is the Life Stage Analysis. Specifically, I want to know what customers do...