October 31, 2017

Going in Opposite Directions

Country Curtains is going out of business.

Mark and Graham (click here) is a five-year-old division of Williams Sonoma.

We've been told by trade journalists and research brands and conferences that we must integrate all of our experiences. A company like Country Curtains does just that, and of what good is the strategy to them? Meanwhile Williams Sonoma launches new brands ... a new brand that is in year five now.

I know, I know, Williams Sonoma doesn't count because they're on the West Coast and if a cataloger isn't in New England it isn't part of the family (#askDuluthTradingCompany).

But honestly, Williams Sonoma is doing what catalogers used to do back in the 1990s before vendors with a megaphone demanded that everything be integrated ... they simply launched a new brand. In the time I was at Lands' End, Eddie Bauer and Nordstrom, we launched numerous sub-brands. No need to integrate everything when you can give a new brand a chance to succeed (and yes, I get it, most do not succeed). In fact, if you integrate everything, you are almost forced not to launch new brands.

It is time to stop doing what is right for vendors holding a megaphone.

It is time to do what is right for your business ... before you become Country Curtains.


P.S.:  Or you can be nasty like Burger King (click here). It's probably not a strategy for most of us, but they're doing something.

October 30, 2017

A Little Something Extra

Watch where the arrow goes at our neighborhood Walgreens (#onthecornerofhappyandhealthy).

Yup - you go through the drive-through and pick up a script and they'll give your pup a dog bone.

Now how much does it cost to do just a little extra than is required?

What programs do you have to do something just a little bit beyond what is required?


P.S.: I never thought I'd see the phrase "Provide a Seamless Experience Across Calendars" offered by the punditocracy but here it is (click here). 

October 29, 2017

#OhBoy

I wrote three weeks worth of "Hillstrom's Optimizer" articles (hint - many more are coming ... and business is absolutely cookin' because of the articles).

I want to share a couple of facts with you.
  • This article (Why The Cataloger Just Can't Stop Mailing Catalogs) was highly clicked-on ... the tables & charts in the article received "highly above average engagement" to use the parlance of some.
  • This article (Moving The Cataloger Into The Future) was virtually ignored ... same tables & charts ... almost no "engagement" whatsoever ... 1/4th the "engagement" observed in the "Why The Cataloger Just Can't Stop Mailing Catalogs" article.
This tells us what many readers are looking for ... readers aren't looking to protect the future of their "brand" ... readers are looking to protect the future of paper.

We all know how that's going to turn out, don't we?

P.S.:  The articles in the P.S. section (like this one about CVS / Aetna ... #OhBoy) are clicked on much more often than the tables that can help you grow your business. Why do you think so many readers choose frosting over meat & potatoes? Also - earlier this year I told you that you were going to have to find partners ... CVS / Aetna is a great example. Think carefully about the parallels between their proposed merger and your business, ok?

P.P.S.:  Here's an important lesson ... my business is absolutely cookin' right now following three weeks of "Hillstrom's Optimizer" posts. This tells us that engagement within the articles is not correlated with business success. I will keep writing the "Hillstrom's Optimizer" posts because a minority of readers yield the desired outcome (for me) ... while a majority of readers participate in "engagement" ... engagement that does not pay the bills. Think about how this relates to your business, ok?

P.P.P.S.: Think what I've had to do with my business over the past 11 years.

  • 2007 - 2009 = Multichannel Forensics.
  • 2010 - 2012 = Contact Strategy Optimization.
  • 2013 - 2016 = Merchandise Forensics.
  • 2017 = Hillstrom's Optimizer.
I've had to re-invent everything I do every three years, on average. If I kept selling Multichannel Forensics projects from 2007 today, how do you think I'd fare? Doesn't a comparable story apply to your business? Which reminds me ... click here to see what a Hillstrom's Optimizer project is going to cost you ... and then give me a holler (206-853-8728 or kevinh@minethatdata.com).

October 26, 2017

Hillstrom's Optimizer: Moving The Catalog Brand Into The Future

Recall our base case.


And then we shut down the catalog division ... and the simulation clearly showed what a stupid idea that was!!


So the strategy isn't to shut things down. Nope.

The strategy is to slowly move into the future. Reduce catalog slowly, increase online marketing slowly, and optimize online marketing channels. Reduce fixed costs slowly as you slowly shut down the catalog division.

This doesn't mean that sales will grow. You're taking a five-year process to rebuild the business, and that's a bumpy process ... but one that can be nicely profitable. Take a look.


I reduced catalog marketing by 20% / 40% / 55% / 70% / 80% as time progressed. This caused a reduction in fixed costs as the process of producing catalogs becomes less labor-intensive and is more automated toward existing creative and existing/winning items and fewer pages, requiring fewer people.

Yes, sales decrease. This is something we already knew would happen.

But profit stabilizes, and cumulative profit is better than in our base case.

So moving into the future requires strategy and vision. It requires a plan ... a multi-year plan. It requires sticking with the same marketing team and the same merchandising team for multiple years, supporting them through sales declines and profit bumps. It requires tolerating sub-optimization in online channels while tolerating gradual declines in old-school channels. It requires patience.

In other words, moving into the future requires a plan that modern business leaders don't generally accept. Do you and your team have the courage to transform a business over a five-year period of time?


P.S.:  Got two minutes? Try something!

October 25, 2017

Hillstrom's Optimizer: Why The Cataloger Just Can't Stop Mailing Catalogs

Here's our base case, as you are all familiar with.


Take a look at what happens if catalog marketing is discontinued.


Oh my goodness.

Yup, the business shrivels up and becomes unprofitable. The business is cut almost in half really quick (that'll happen when you have a 50% organic percentage), and then a lack of file momentum and new customers drive the business even smaller.

This is the reason the typical cataloger cannot just stop mailing catalog and move into the 21st Century ... the entire business is fueled by the catalog and the effort to move into the future causes the business to become unprofitable.

Regardless, the cataloger has no choice but to move into the future. So we'll address that issue tomorrow.

P.S.:  Pick your partners (click here).

October 24, 2017

Hillstrom's Optimizer: Productivity

We have our base case:


If we optimize for year one performance and then invest that way going forward (which is what almost all of you indirectly try to accomplish), we get this solution.


The business isn't going anywhere by the end of year five, is it? It's optimized, but it is optimized on to a local maxima. There are many other ways to get better results, but you have to sub-optimize early on in order to get optimal results later.

But that's not the topic of our post today.

Can I show you something?

What happens if we increase Merchandise Productivity by 10%, and hold Merchandise Productivity at +10% for five years?


Over the course of five years, cumulative Earnings Before Taxes increased by +/- 60% ... all from a 10% increase in Merchandise Productivity.

Now you know why I continually harp on Merchandise Productivity!


P.S.: Gap launches a subscription program for Baby Gap (click here). You keep telling me you love customer loyalty ... more than customer acquisition ... so why not Try Something!!

October 23, 2017

Hillstrom's Optimizer: Heavy Five Year Investment

Here's our base case.


Then we invested heavily in radio/television for a year, and the trajectory of the business changed.


What happens if we invest heavily for five consecutive years?


Look at the top line, look at total sales ... this business is growing ... it's going somewhere!

The business isn't terribly profitable ... we give up twelve million dollars of profit over five years, but we get growth in exchange for what we give up.

Business is all about choices. Businesses that grow tend to have one of three things working in their favor.
  1. They have increasing merchandise productivity, and that funds growth.
  2. They have a low-cost / no-cost customer acquisition program that fuels growth.
  3. They reinvest profit, and that funds growth.
If we want to get out of a tepid growth pattern, we'll have to pick a different path. We could reinvest profit, but then that means somebody doesn't get paid.


P.S.:  Low-Cost / No-Cost customer acquisition programs appeal to you? Create sheep with personalities!! (click here).


October 22, 2017

Hillstrom's Optimizer: Being Like Amazon

Remember our base case for this business?


Like so many of the businesses we manage, this business is STUCK. It's going nowhere. Sales are generally flat (or increasing by 1% - 3% per year). It's a business that is wandering in the wilderness.

It's also a business that pockets profit (cash).

What if this business didn't pocket the profit (cash) generated by operating the business? What if the business invested the money? Even in a marketing channel with a lousy return on investment - like radio/television?

Let's do that for just one year - and then we'll go back to what this business used to do. Take a look at the example below - where I invest an additional $10,000,000 on radio/television advertising.


Look at that ... the top-line grows by 20%, profit is nuked (but the business is still profitable) ... and then something interesting happens ... the business, even after reverting back to normal, becomes MORE PROFITABLE over time.

MORE PROFITABLE!

See, those customers from the heavy investment year become good customers over time and start delivering profit.

What happens if we invest heavily in radio/television EVERY year? Maybe the business looks more like Amazon? We'll find out tomorrow.


P.S.:  I talk a lot about low-cost / no-cost customer acquisition? Why? Because you are competing indirectly against people like Disney who may have to spend $150,000,000 marketing a new streaming service to customers (click here).


October 19, 2017

Hillstrom's Optimizer: Looking At Incremental Profit

Here is our base case.


Now, let's double the catalog customer acquisition budget for just one year. We end up with this outcome.


Ok, we end up with 322,081 first-time buyers ... the base case yielded 285,830 first-time buyers. Incrementally, then, we have 36,251 additional new buyers.

Now let's compare profit by year.
  • Year 1 = Loss of $1.8 million.
  • Year 2 = Profit of $1.2 million.
  • Year 3 = Profit of $0.8 million.
  • Year 4 = Profit of $0.6 million.
  • Year 5 = Profit of $0.4 million.
Divided by 36,251 additional buyers.
  • Year 1 = Loss of $50.81.
  • Year 2 = Profit of $33.99.
  • Year 3 = Profit of $21.68.
  • Year 4 = Profit of $15.64.
  • Year 5 = Profit of $11.31.
  • $50.81 lost in first year offset by $82.68 profit in years two through five.
Your own Optimizer project should be able to identify these issues. Do you see how useful the Optimizer spreadsheet is? You get to play with different scenarios, you get to run different simulations ... and most important, two things happen.
  1. You figure out what the right path is for your business, moving forward.
  2. You learn more about how business works than others at comparable companies. You end up being so much smarter than everybody else.
This is why we run Optimizer spreadsheets!


P.S.:  Amazon has a luxury problem (click here).

P.P.S.:  Lord & Taylor to sell on Wal-Mart's website (click here). I told you earlier this year that it will be important to carefully pick your partners ... 

P.P.P.S.:  READ THIS DOCUMENT NOW (click here) ... read the bottom of page 77 and the top of page 78. Go read this ... NOW!

October 18, 2017

Hillstrom's Optimizer: Short-Term vs. Long-Term Tradeoff

This was our base case.


Last week, I talked about expanding search marketing ... and showed how you can overspend in the short-term to generate long-term health.

The same issue happens in catalog marketing (and in all marketing, for that matter). We have to decide if we want profit today, or sales + profit tomorrow.

For instance, here is a five year scenario if we increase the customer acquisition budget by a factor of 1.8x for five years within catalog marketing.


Look at what happens to top-line sales ... you have a business that is growing ... growing faster than the tepid growth rate otherwise witnessed.

Look at the change in profit. Here is the case where catalog customer acquisition is increased by a factor of 1.8x.
  • Year 1 = $7.8 million.
  • Year 2 = $9.5 million.
  • Year 3 = $10.7 million.
  • Year 4 = $11.6 million.
  • Year 5 = $12.2 million.
  • Net Sales After Year 5 = $141.5 million.
  • Five Year Profit = $51.7 million.
Here is our base case.
  • Year 1 = $9.2 million.
  • Year 2 = $9.9 million.
  • Year 3 = $10.5 million.
  • Year 4 = $10.9 million.
  • Year 5 = $11.2 million.
  • Net Sales After Year 5 = $124.6 million.
  • Five Year Profit = $51.6 million.

Which business would you prefer to manage in the short-term?

Which business would you prefer to manage in the long-term?

We're not having the right conversations, are we? We look for "Three Tips To Improve Your Instagram Strategy" when we should have a conversation about "What Is Our Strategy"??!!

October 17, 2017

Hillstrom's Optimizer: Oh, Maybe The Optimizers Were Wrong

Our base case:


Then here's what happens when you optimize every single individual year as each year comes down the turnpike:


The business is eleven million dollars more profitable by doing this than by following the base case. So, WOW! Life is good! The optimizers were right ... they optimized each year and made you a fortune.

One problem.

In our optimized solution, where each individual year is optimized, we aren't bringing on enough new customers. The "optimal" solution in an individual year was to cut catalog customer acquisition by 65%.

What happens if, instead of cutting customer acquisition spend via catalogs by 65%, we double catalog customer acquisition spend? I know, that's crazy ... that's not the optimal solution!!!


Oh. My. Goodness.

I mean, we optimize each individual year, and we get a better answer.

Then we sub-optimize the answer and we get an answer that is SO MUCH BETTER!!

So what have we learned?
  • Optimization is good.
  • Sub-Optimization is better, especially when it comes to Customer Acquisition.
The secret to business, then, appears to require us to optimize to a point. To a point. And then, we need to sub-optimize the areas of our business that generate new customers ... as long as we sub-optimize to the point where long-term value is maximized.


P.S.:  You've heard of You Goat Mail, right? No? Well go check 'em out. And when you either buy or receive a goat you become a member of the "Goat Herd" (click here). What do you see when you visit the page? You see a ton of low-cost / no-cost customer acquisition awareness. It's not hard to create a club that has no real meaning and no benefits, but is cute. Try something!

P.P.S.:  NEMOA Sponsorship Opportunities (click here).

  • $2,800 = Host a Roundtable Session.
  • $5,500 = Host a Roundtable, Introduce a Session.
  • $11,000 = Speaking Opportunity (Not Guaranteed), Host Roundtable, Introduce Session. One Table for Sales Materials.
  • $21,000 (5 only) = Private Board and Speaker Event, Speaking Opportunity (Not Guaranteed), One Table for Sales Materials, Video Clip played in front of General Audience. Conference Organizers will find a unique way to get Sponsor Noticed.
  • $26,000 (1 only) = Guaranteed Speaking Opportunity, Guaranteed Roundtable Speaking Opportunity, Video Clip played in front of General Audience.
  • Go to the last page ... 1 sponsor @ $26,000 + 4 sponsors @ $21,000 + 6 sponsors @ $11,000 + 13 sponsors @ $5,500 + 21 sponsors @ $2,800 = $306,300.
  • This is a very small ... humble conference ... and they're ranking in more than a quarter-million dollars from sponsorship. What is easier ... generating $306,300 in sponsorship fees or finding 400+ attendees? You already know the answer ... and now you know why conferences are overrun by vendor-centric everything ... and now you know why the attendees are folks who are dazzled by vendor-centric everything ... and now you know why conference topics don't align with the actual problems/challenges you face.


The MineThatData Visualization Challenge!!!!

We hear an awful lot about "best practices" for data visualization.

How about testing your chops by analyzing and then displaying your recommended strategy based on seven test panels in this image?

Send me your answer by October 31, 2017. Your job is to produce one graph/viz/slide that explains what strategy the Executive should implement.

Send me your answer via Twitter (@minethatdata) or via email (kevinh@minethatdata.com). All submitted answers will be shared via Twitter. The "best" answers via whatever criteria I and/or my Twitter followers decide will earn a copy of Hillstrom's Fix It!

What better way to test your solution and garner some attention than to analyze the data in this image and then produce one (1) page/slide/viz that explains the strategy you think the Executive should use, going forward?

Go make something magical happen!!

October 16, 2017

Hillstrom's Optimizer: Our Optimization Teachers Were Right!! (Or Were They?)

Here is our base case.


Then we optimized year one results - and the results were pretty darn good!! You can see year one below ... but just as important, I optimized all the way through year five. What did we learn?


We learn that optimization is good (mostly)!!!
  • Over five years, we generate $62.4 million in cumulative profit. That's a lot better than the $51.6 million generated in our base case. A lot better!
  • Top-line sales, however, are stuck.
  • And as top-line sales begin to decline in years 4/5, optimized profit also begins to decline in years 4/5.
In other words, the process of optimizing a company results in improved profit ... and eventually leads to a business that is stuck.

If we repeatedly optimize a business for current year results, we'll get good results ... but we'll also be left with a business that is stuck.

Then what?

You already know the answer.

Then we have to sub-optimize the business to get the business to grow once again.

The optimizers were partially right. We have to do two very opposite things.
  • We have to optimize a reasonable amount.
  • And we have to sub-optimize if we ever want to achieve our potential.

October 15, 2017

Hillstrom's Optimizer: But We're Taught To Optimize!!

Here's our base case:


I ran a scenario where I fully optimized the business for profit in Year 1.
  • 0-12 Month Catalogs = +60%.
  • 13+ Month Catalogs = -40%.
  • Acquisition Catalogs = -35%.
  • Email = +100%.
  • Search = -10%.
  • Online Marketing = +60%.
  • Radio / TV = -70%.
Here's our base case:
  • Sales = $115.5 million.
  • Profit = $9.2 million.
But with the "optimized" solution, here's what we have to show for ourselves.


  • Sales = $114.6 million.
  • Profit = $11.9 million.
The business is about a million dollars smaller, but profit is $2.7 million dollars better.

Tomorrow, I'll run through an example where we optimize every year out through year five. What do you think will happen? I mean, we've been taught to optimize the business, right?!


P.S.:  Omnichannel experts told us that we'd integrate all our channels and experience riches. The opposite happened. And now Spirit Halloween is filling the void (click here).


P.P.S.:  Conrad forwards us this beauty about Columbus, Ohio ... a retail experimentation market (click here). Hey readers in New England ... what would stop you from creating your own version of this?


P.P.P.S.:  When you experiment, you move toward the future. This is what you leave (click here).


P.P.P.P.S.:  When I offer the links at the bottom of a post, I compare how you click on the articles vs. the tables offered in the post. You already know which slice of content you prefer, don't you? So then I look at the links you click on the most, because that tells me what you "think" is important/interesting to your business. This is the most popular link of the past two months (click here) ... with nearly 10x as many clicks as the average link. It says something about the state of this industry.

October 12, 2017

How Are You Doing This?

I know, I know, you are looking at the tables from Hillstrom's Optimizer, and you have questions.
  1. How is he doing this?
  2. How can I figure out what is wrong with this?
Those of you who have been exposed my content for almost twelve years know how I do everything, because every method used in my Optimizer worksheet has been shared with you ... repeatedly.


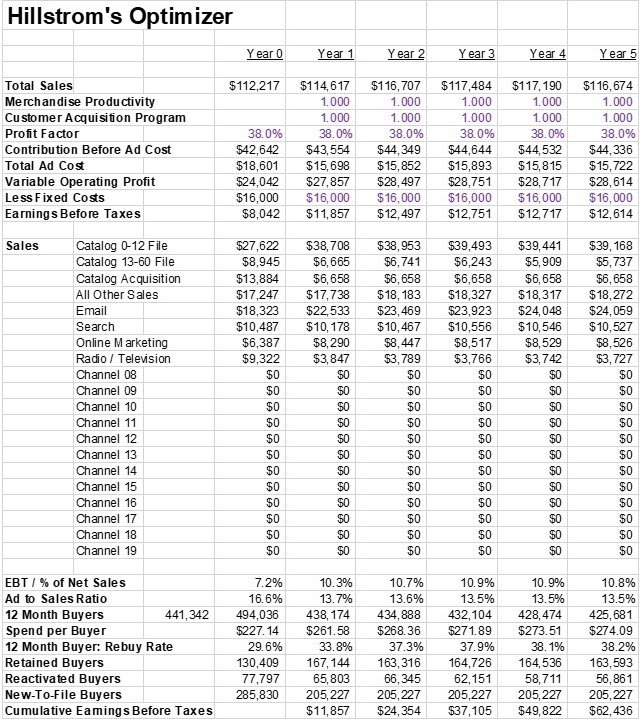
For the 0-12 month file, I have nine segments ... segments created by a Principal Components Analysis. I enter the square root of three year demand, and I enter percent of demand spent over the past three years by attributed marketing channel.

I have lapsed buyer segments ... 13-24 month, 25-36 month, 37-48 month, and 49-60 month buyers.

I have nine new buyer segments ... new buyers that enter the business via each of the nine segments for twelve-month buyers.

For each segment, I measure the following:
  • Next Year's Rebuy Rate.
  • Next Year's Spend per Repurchaser.
  • Which Segment The Customer Migrates To Next Year If The Customer Repurchases.
  • The Share Of Next Year's Demand Generated By Attributed Marketing Channel.
This stuff is not complicated ... companies like Fingerhut were running "nameflow" models in the 1980s which are not fundamentally different than what I use. The PCA analysis / procedure, as best I can tell, isn't used by anybody.

Say email marketing is accountable for 40% of next year's demand, and say that the segment has a 40% chance of buying again next year. I take 40% * 40% = 16% ... and this becomes what I use to measure email marketing effectiveness.

I then use power functions (a^x) to approximate what happens if you double or triple email marketing contacts. Often, the "x" value in the power function is 0.5 (the square root function).

Example: Say we want to double email marketing frequency. We know that the customer has a 40% chance of buying again, and if the customer buys again, 40% of repurchase activity will happen via email marketing. Here's the equation:
  • (40% * 40%) * (2.00 / 1.00)^(0.5) = 0.227 ... the fraction of repurchase rate generated by email marketing goes from 16% (40% * 40%) to 22.7%.
Example:  Say we want to end email marketing.
  • (40% * 40%) * (0.00 / 1.00)^(0.5) = 0.000. The fraction of repurchase goes from 16% to 0%.
This process is repeated over and over and over again for each marketing channel, yielding an adjusted annual repurchase rate by segment.

Then the process is repeated year-over-year for five years.

Toss in Merchandise Productivity and Profit Factors and Ad Cost assumptions and guess what? You have Hillstrom's Optimizer!!

You can do this yourself ... I've given you every single tool you need ... all you need is a simple Excel Spreadsheet and thorough knowledge of how customers respond to marketing channels. That's it. That's exactly what you should know, right??!!

We'll continue with examples next week. You can do the work and create your own spreadsheet ... I've given you everything you need to know here to be successful.

But if you want me to run your data through my Optimizer spreadsheet, give me a holler (kevinh@minethatdata.com).


P.S.:  Having a hard time convincing your Executive Team to do anything different? Then read this article about how Lowe's creates Comics to help the Executive Team see what the future might look like (click here). I know, I know, what's the return on investment of creating Comics for your Executive Team ... there's nothing "funny" about business? Try something!

P.P.S.:  I tweeted this quiz Thursday afternoon ... look at the results (click here).

October 11, 2017

Hillstrom's Optimizer: Let's Go For Broke!

We doubled the search budget ... and it appears that doubling the search budget was the right thing to do.


So now it's time to quadruple the search budget ... let's go for broke! Let's double the doubling of the budget!


Ooops.

Ok, we learned that we went too far.

We learned that we could probably double the search budget and meet both short-term profit goals and long-term profit goals.

We learned that there are limits to marketing spend.

How would you broach this subject with your CEO/CFO? Let's say you want to double your search budget. If you double it, you won't see the benefit for 2-3 years. How would you encourage your CEO/CFO to embrace what an optimization simulation is showing?


P.S.:  Want a low-cost / no-cost customer acquisition method? J. Crew decided to write sponsored content on Deadspin (click here). Here's how I got to it ... I saw a tweet about how World Series teams are built (click here), which led me to an article from 2013 ... when I finished reading the article the sponsored content appeared next. As you can see, the article was allegedly read 238,000 times (who knows if that is a lie or true). 


October 10, 2017

Hillstrom's Optimizer: Short-Term / Long-Term Tradeoff

Recall our discussion from yesterday? No? Well, we started with our "base case" for this business.


And then we doubled the search budget for year one. This sub-optimized the business in year one ($0.5 million less profitable) but improved long-term sales and profitability. Losing money in year one was easily the "right" thing to do.


What would happen if we doubled the search budget EVERY YEAR? How is the business impacted? Do we sub-optimize short-term profit (yes)? Do we optimize long-term profit?


Look at that!

It takes two years, and then profit starts improving.

After five years, the business is ten million dollars bigger (sales) and profit is a million dollars a year better ... and cumm five-year profit is better than in the base case.

So by sub-optimizing short-term profit EVERY YEAR the business is more profitable over time and is ten million dollars bigger.

Do you understand what this means?

When you optimize the short-term health of your business, you sub-optimize the long-term health of your business.

Yes --- everything you've been taught about business and optimization is probably wrong!!

Do you ever wonder why your business doesn't grow like you think it should grow? Hmmm.

Do you ever wonder why Amazon purposely chooses to not make a profit? Hmmm.

You can learn all these fun tidbits by running Hillstrom's Optimizer ... or by creating your own Optimizer.

Go do it!!


P.S.:  Read this (click here). We're gonna have to pick our partners soon. You might not like that Amazon gets 20% of every sale, but catalogers happily pay co-ops $0.06 per catalog mailed, and then 1 in 100 customers purchase something. So if you have a $100 AOV you're giving the co-ops 6% of every sale, not to mention what you gave your paper rep and your printer and the USPS. Give Amazon 20% or give paper-aligned vendors 40%? Something to consider. And remember - if you do that - if you give Amazon the dollars instead of the Print Ecosystem, you become a pawn to Amazon. They can toss you in the waste basket at any time. You are the one who needs to be strategic. Tepid but predictable business in the Print Ecosystem, or growth aligned with frightening risk in the Amazon Ecosystem? Think carefully about both.

What Happens At Different Life Stages?

One of the first analyses I run in a Merchandise Dynamics project is the Life Stage Analysis. Specifically, I want to know what customers do...