December 30, 2018

Adjusting The Budget

For the most part, digital analytics fail to allow the aspiring analyst to perform budgeting work. You know who converted and how they converted and where they came from. You don't know how much you "should" spend.

If you know nothing, go with a rule of thumb (but be sure to get the appropriate data so that you know "something").

Say you are trying to figure out an appropriate paid search budget for January. Here's what has happened each of the past five years:


The relationship can be depicted graphically ... and therefore, can be modeled.


Now that we have a relationship, we can estimate the optimal amount of spend.


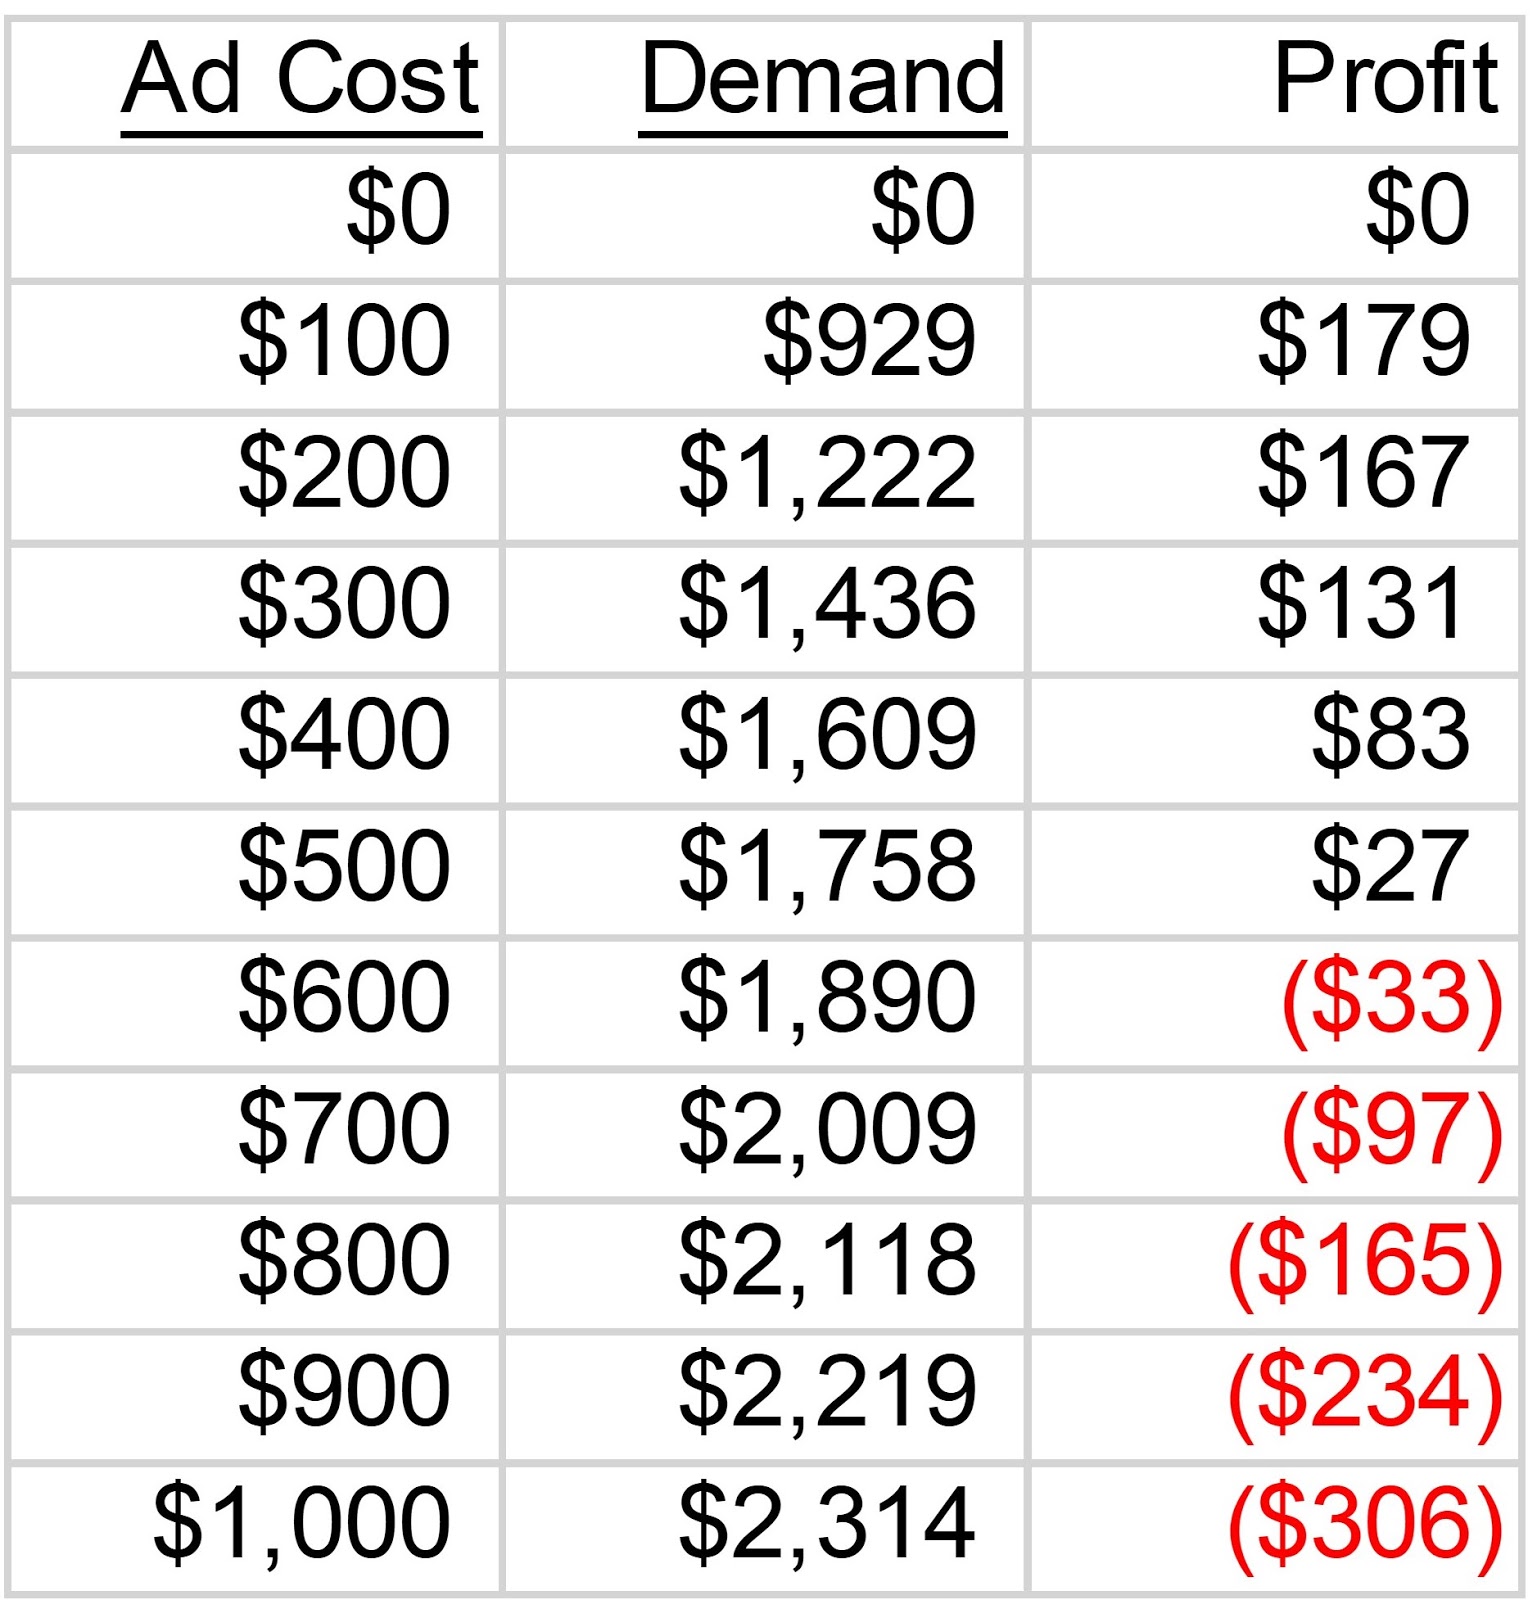
Sit down with your CFO and go over your options ... you now have a relationship based on historical data that you can rely upon!!


December 26, 2018

The Draft

When your favorite sports team fails, you go back and look at what went wrong. Three things frequently come to mind.

  1. Financial mismanagement.
  2. Poor drafts that result in having too few good players from previous drafts.
  3. Free agent signings that become "busts".
As a Green Bay Packers fan, I've seen the impact of (2) over the past five years. This year, the team staggers to the finish line, missing a core of 15 players +/- that should fuel success but aren't because the wrong players were drafted since 2013. As too few draft choices panned out, the team was forced to sign free agents ... and the free agent signings didn't pan out either. The result? A 6-8-1 record heading into the Toilet Bowl game against Detroit.

Why bring this up?

The same issues plague your business. Ask your CFO about financial mismanagement. There was a quarter at Lands' End back in the 1990s when business was ok but profit was bad because of the mismanagement of exchange rates between the US and Japan and Germany and the UK and I can still hear the Finance folks being berated by Gary Comer.

Poor drafts in sports are like bad merchandising classes. You look at "Class Of" reporting, right? RIGHT??? Two bad years of new merchandise mean three tepid years (unless you are a fashion brand) of subsequent existing merchandise performance. New merchandise classes are like draft classes in the NFL.

Free agent signings are like trying to make big splashes in partnerships (or influencer marketing) and then seeing it go horribly wrong.

As we head toward 2019, run your darn "Class Of" report and see if your brand is suffering from the same issues that sports teams suffer from.


December 25, 2018

Check The Stats

It's common for somebody to increase discounts, especially in November and December. You've got to get market share, right? (or do you?).

This year, you sold at 40% off (on average). Last year you sold at 30% off (on average).

So you'll look at your twelve-month buyer file (as of 10/31), and you'll measure a handful of repurchase metrics.
  • Rebuy Rate = 22%.
  • Spend per Repurchaser = $135.
  • Customer Value (rebuy * spend) = $29.70.
Then you'll look at last year.

  • Rebuy Rate = 21%.
  • Spend per Repurchaser = $132.
  • Customer Value (rebuy * spend) = $27.72.
The analytics guru will say that spend increased by 7% (29.70 vs 27.72) and will say that "all is good" and the marketing team will pat themselves on their backs and everybody but the CFO will move on and celebrate a successful season.

Why is the CFO choosing not to celebrate?
  • 2018 Gross Margin Dollars = ($29.70*0.60 - $29.70*0.35) = $7.43.
  • 2017 Gross Margin Dollars = ($27.72*0.70 - $27.72*0.35) = $9.70.
  • Change = -23%.
When measuring response, please check the stats ... don't just look at the stuff Google tells you to analyze ... and don't trust your classic rebuy / spend / value metrics. 

Look at Gross Margin Dollars.


December 23, 2018

Merry Christmas!!


For the thirteenth year (#amazing ... a tradition that began in December 2006), Merry Christmas!!

December 20, 2018

Outrunning A Recession

No, you aren't going to be able to outrun a recession. 

Not by a long-shot.

But you can position yourself to weather the recession better than your competition.
  1. Make sure your Inventory Management Team is not buying to forecast. The last thing you need to do is mark down good merchandise because you didn't plan ahead.
  2. Instead of discounting in the short-term, over-invest in marketing. The goal is to get through inventory now and get new customers in the process ... it's better to lose money acquiring a customer than to lose money via discounts/promotions ... the former gets you a new customer, the latter gets you a new/existing customer who expects to never pay full price again.
  3. Be ready to then reduce marketing spent at a moment's notice. Know exactly where you can reduce marketing spend with virtually no impact on the total business ... y'all have cases where you are spending money and not obtaining a return on investment ... be ready to pull those dollars immediately, protecting your profit and loss statement.
  4. Stop expensive marketing among customers with high return rates ... why churn merchandise during a recession? If the customer has a high return rate, shut the customer down. Let your competition deal with unprofitable transactions.
There's probably 22,000 different ideas and tactics. Get your grease board out, write down the ideas / tactics, and begin executing the minute your metrics suggest you are headed into a recession.

December 19, 2018

Marketing Challenge vs. Recession

Let's say you have four key customer acquisition efforts:
  • Google
  • Facebook
  • Other Digital
  • Offline
Let's say that your comps were flat in September / October. Now in November and December, you observe this:

  • Google = -9%.
  • Facebook = -7%.
  • Other Digital = -11%.
  • Offline = -6%.
  • Merchandise Productivity = -10%.
If you observe this issue, you do not have a marketing challenge ... you have to revisit yesterday's post to determine if you have a merchandising challenge or you are headed into a recession.

Let's say your data looks like this:
  • Google = +1%.
  • Facebook = -7%.
  • Other Digital = -11%.
  • Offline = +3%.
  • Merchandise Productivity = -1%.
This is what a marketing challenge looks like. Google and Offline have signatures comparable with Merchandise Productivity, while Facebook and Other Digital are plunging.

Make darn sure you are running these analytics ... and if you aren't, get the booklet below from Amazon to help you do 'em.


December 18, 2018

Merchandising Challenge vs. Recession

Let's pretend you have a traditional apparel business with five categories.
  • Mens
  • Womens
  • Co-Ed
  • Kids
  • Home
You run your comp segment analytics for November - December (your comps were about flat for September - October), and you see this:

  • Mens = -8%
  • Womens = -11%
  • Co-Ed = -9%
  • Kids = -7%
  • Home = -10%
This is the signature of a recession or a complete merchandising meltdown. More often than not, it's the signature of a recession. The percentages are all about the same, and all switched to negative at about the same time.

Here is the signature of a merchandising problem.
  • Mens = +4%
  • Womens = -11%
  • Co-Ed = -3%
  • Kids = -7%
  • Home = +5%
Notice that Mens and Home are positive. Notice that Co-Ed is an average of Mens/Womens. This is what a merchandising problem looks like ... your merchandising team messed up Womens/Kids and is hurting the business as a consequence.

Be darn sure to measure this stuff, and know if you have a recession on the horizon or if your merchandising team needs some assistance. And if you don't have the tools to do this work, check out the booklet below, available on Amazon.


December 17, 2018

Five Signs That A Recession Is About To Overwhelm Your Business

It's not hard to detect trouble. In fact, you probably have already created a dashboard to determine when trouble is on the horizon. It's been my experience that there are four key signs that trouble is brewing ... read those below ... and read paragraph two (click here) where 50% of business leaders think a recession could be a month away (which likely means recession isn't a month away).


Sign #1:  Customer Acquisition performance is failing. This won't be a channel/tactic-specific challenge. You'll simply notice that it is much, much harder to acquire new customers at the same cost you used to be able to acquire customers at.


Sign #2:  As customer acquisition performance fails, somebody in your company demands that you generate more revenue from existing customers, pushing you toward expensive customer loyalty initiatives. This trend is being covered extensively by the trade industry, and that worries me.


Sign #3:  When customer acquisition becomes more expensive and loyalty initiatives prove too costly with minimal return, somebody in Finance or on your Merchandising Team will decide that all new items are going to be more expensive. This tactic "can" work ... yup ... it can ... but too often it doesn't work, and when it doesn't work customer acquisition is hurt even more (new customers find the assortment too expensive) and loyalty efforts are hurt (because any gains in loyalty work are offset by lower response to more expensive items). Again ... this tactic "can" work, but it requires Merchandising Brilliance. If you don't have Merchandising Brilliance, wade into the water very slowly.


Sign #4:  As 1/2/3 above all interact to create a swirling bowl of failure, Merchandise Productivity fails ACROSS THE BOARD. This is a key distinction ... when you have merchandising failures, some categories perform poorly while other categories perform average or above-average. This is not the signature of a recession. The signature of a recession includes across-the-board failure in all merchandising categories, all price points, and all customer segments.


Sign #5:  In response to 1/2/3 and in response to you showing the company that (4) is happening, your Marketing Team and/or Inventory Management Team decide to offer deep discounts coupled with frequent promotions.


You already measure much of this stuff ... so you know if a recession is coming or not. If you don't measure it, go read the book below and use the techniques in the book to identify if recession is coming your way.

Purchase Hillstrom's Total Package on Amazon


December 16, 2018

Recession

Finance folks have ways to forecast that a recession is coming. In recent weeks, the topic of the "yield curve" suggests that the economy is headed toward a recession in the next 6-36 months, +/- (click here).

There are signals that suggest a recession is headed for your business as well. In e-commerce and/or retail, there are sure signals that trouble is coming.

Tomorrow, we'll begin to discuss the signals. Be sure to use the tools and techniques that you've been taught over the past decade to identify when trouble is coming.


P.S.: "Having a great Christmas Season" is mutually exclusive from "A Recession is Coming." Both can be possible. Think of it this way. You eat a ton of bad food, and you don't gain a ton of weight. That doesn't mean you don't have a blood sugar issue, right? The sugar high our economy is enjoying may well be separate from the fact that trouble is brewing ... and you have customer data that can help you understand if trouble is brewing.

December 13, 2018

All These Little Taxes ... And Big Taxes Too

For twenty years, Amazon capably made a ton of profit ... they just didn't pass it on to shareholders ... instead, they reinvested the money in the business (thereby avoiding state and local taxes). You do that for two decades non-stop and you might just end up with a competitive advantage ... meanwhile the rest of us do our civic duty and it makes it harder to grow fast over time.

Amazon gets a lot of data ... you give them a ton of data for free. Think about it. You sell on their platform, and they make money off of your transactions and they learn what works and what doesn't work with your product assortment. You get some money. Seems like the fairness of the transaction is out of balance, #amirite? In other words, there's a data tax ... you are paying the data tax to Amazon, and they reinvest the knowledge elsewhere in their business.

Now let's get back to typical brands. Think about all of the taxes you are paying.
  • Every month you pay a paper tax. Yup. You pay paper and postage and printing ... those dollars go out the door and they don't come back. I know, you'll say those dollars generate sales and you can't get the sales without the paper. Nonsense. I was part of a team that shut down a catalog division at Nordstrom and without $36,000,000 in paper expense our online sales GREW and retail sales GREW and profit INCREASED. And we had mail/holdout tests to prove that wouldn't happen. It happened.
  • If you prospect with paper, you pay a data tax. You give your co-op data FOR FREE. Why do you do this? You give them data FOR FREE and then they sell you data in kind for a fee. Meanwhile, the co-op pumps your data into their ecosystem and they make money ... you are ultimately paying a tax.
  • If you are a mall-based retail brand, you are paying an 8% +/- tax to have a physical presence. That money goes out the door each month and doesn't come back. I know, I know, you'll say that without the physical presence you won't sell anything. And yet, there are experiential brands who now have physical stores where they pay the tax and don't even bother to sell anything, so that's another whole step removed from selling. In either case, the brand is paying a tax.
  • E-commerce brands pay taxes too ... Google and Facebook are modern tax collectors. They have the audience (i.e. everybody), and they collect a tax for the right to communicate to a customer. Retargeters aren't much different ... collecting taxes all over the internet.
The entire omnichannel thesis is designed to get you (the brand) to pay myriad third parties taxes to theoretically get you access to customers.

Even attribution algorithms and databases and the machine learning magic you're being taught ... they're all taxes.

The job of a modern "brand" is to pay as little in taxes (defined as fees paid to third parties, especially fees paid to gain temporary access to customers and prospects) as possible. This needs to be a significant part of your 2019 goals and objectives.


P.S.: Watch this video (click here) and tell me you don't want to buy this thing? You sell something that deserves this style of attention, right?

December 12, 2018

$10,000,000 Market Cap per Employee?

That's what is mentioned in this transcript of a podcast (click here).

How many employees do you have and what is your market cap? Then do the math.

Think of the contrast this way.

  • Google = $10,000,000 market capitalization per employee.
  • Nordstrom = $125,000 market capitalization per employee.
The transformation of the past decade has been breathtaking. Successful companies have figured out how to make money without people or without marketing or without fixed costs.
  • High sales per employee.
  • Low ad-to-sales ratio.
  • Minimal fixed costs.
  • You either generate revenue from data or you pay for data.
Evaluate yourself on each bullet point above. How does you company stack up?

December 11, 2018

Progressive

As best I can tell, Progressive (yes, the company that has all of those commercials with "Flo") generates $25 billion in annual revenue and spends a bit more than $500 million on marketing.

That's a 2% ad-to-sales ratio.

And they apparently pay "Flo" $500,000 a year ... 1% of their marketing budget.  All stats can be identified via Google searches.

There are ways to not spend 25% - 30% of net sales on paper.

December 10, 2018

Renting

Advertising is largely a rental platform ... you rent space or paper or a click, and it's your job to demonstrate that you made a good investment.

The smartest companies tend to have low ad-to-sales ratios. In other words, the smartest companies do not need to rent attention, they generate their own attention.

Facebook ad-to-sales ratio in 2017? 11.6%.

Alphabet/Google ad-to-sales ratio in 2017? 11.6%.

Well isn't that interesting?

Apple last disclosed marketing spend in 2015. Their ad-to-sales ratio that year? 3.5%.

Amazon's ad-to-sales ratio in 2017:  5.6%.

Wayfair ad-to-sales ratio in 2017:  10.3%.

A typical cataloger somehow possesses a 22% - 33% ad-to-sales ratio. Yeah, how the heck is that possible in a modern world?

And retail isn't much different ... instead of renting clicks or paper or 30-second slots you are renting real estate

If you have to rent more than 15% of your sales (effectively passing pure profit to third parties), you've got problems.

If a competitor spends 10% less on marketing than you spend, then the competitor has 10% of sales to spend on everything else to out-compete you.

And if your response to this is "yeah, but if we don't spend the money we don't get the sales", then you have absolutely messed up your business and need to start a new marketing plan, don't you?

In 2018, there's too many initiatives that require money. Marketing cannot consume 25% or 30% of annual sales.

December 09, 2018

Channels Influence What Sells

I know, I know, you are supposed to offer the same merchandise in every channel and create a frictionless omnichannel customer experience ... because that's what the customer wants, or so we are told. Then the customer goes and buys from Amazon anyway.

There are channels that customers prefer specific merchandise. Twenty years ago at Eddie Bauer, 40% of what we sold online was extended sizes ... yup, the customer didn't want to buy the XXL Tall shirt in a store, so he bought it online. 

It's no different today. Each channel possesses strengths, and each channel possesses weaknesses. You'll understand this when you evaluate future merchandise preference by historical channel preference.

Here's an example from a recent project.
  • Historical Preference - Catalogs = 37% buy from Merchandise Category 14 in the future.
  • Historical Preference - Online = 27% buy from Merchandise Category 14 in the future.
  • Historical Preference - Email = 29% buy from Merchandise Category 14 in the future.
  • Historical Preference - Search = 25% buy from Merchandise Category 14 in the future.
  • Historical Preference - Customer Assistance = 24% buy from Merchandise Category 14 in the future.
We learn that there's an interaction between customers who historically loved catalogs and customers who buy from Merchandise Category 14 in the future.

This is a big deal. Why?
  • Companies that try to evolve their catalog toward an "omnichannel merchandise assortment" are companies that have problems with catalog productivity.
In other words, the catalog can be really hard to change, because there's a predisposition for some customers to align with certain merchandise categories. When you homogenize the whole experience to please the omnichannel customer experience thesis, you erode profitability.

Let each channel cater to the customers who love the merchandise in that channel. You can offer the same stuff across channels, but you don't have to FEATURE the same stuff across channels, ok?

December 06, 2018

Email Marketing and Discounts

It comes up over and over again.

The email marketing team wants to maximize open rates (not profit, mind you, open rates). How does one do that? Great merchandise? Well, sometimes. More often, of course, is that the marketing team will apply discounts / promotions - or will be directed by Management / Merchandising to apply discounts / promotions.

Soon thereafter, the process is institutionalized - an in-house best practice. Worse, customers learn that the process is institutionalized.

Here are some results from a recent project, featuring the preferred historical channel used by customers - measuring how much demand will be tied to a discount in the next year:
  • 23% = Print / Catalogs.
  • 30% = Online / All Other.
  • 46% = Email Marketing.
  • 26% = Search.
  • 33% = Online Customer Assistance.
Look at customers who spend the majority of their money via email marketing ... their rate of discounting next year is at 46% - compare that to print . catalogs, which are at 23%.

Say your average discount is 30%. Say your cost of goods is 40%.


Gross Margin Dollars via Print / Catalogs per $100:
  • Full Price = $100 - $100*0.40 = $60.00.
  • Discounting at 30% off = $70 - $100*0.40 = $30.00.
  • Weighted Average = 0.77*$60 + 0.23*$30 = $53.10.

Gross Margin Dollars via Email per $100.
  • Full Price = $100 - $100*0.40 = $60.00.
  • Discounting at 30% off = $70 - $100*0.40 = $30.00.
  • Weighted Average = 0.54*$60 + 0.46*$30 = $46.20.

Gross Margin Dollars via All Other Online Activity per $100.
  • Full Price = $100 - $100*0.40 = $60.00.
  • Discounting at 30% off = $70 - $100*0.40 = $30.00.
  • Weighted Average = 0.70*$60 + 0.30*$30 = $51.00.

In this case, you lose $6.90 for every $100 in email demand (vs. print/catalog demand). You lose $4.80 for every $100 in all other online activities.

If you give the email subscriber your best discounts/promotions, don't be surprised if the customer becomes trained to use email marketing ... not because it is a good channel ... but because that's where the discounts / promotions are found. Now you've got to work 7% harder just to get back to break-even.


P.S.:  Here's an example of a marketing team running a promotion and causing problems (click here). I've made huge mistakes in my career, so everybody is going to have problems from time to time. One of the challenges I'm seeing in 2018 is the inability of a generation of Digital Leaders to think three steps ahead in the offline world. It'll get fixed, often via bad experiences.

December 05, 2018

MLV: Where You Feature Items Matters

In a recent project, I attached customer repurchase activity next year to the items a customer purchased last year. Then, I build a regression equation to determine if various merchandise categories and/or marketing channels and/or other factors play a role in helping an item launch customers to loyal status.

Here's what I learned (after controlling for customer quality).
  • Items featured in catalogs caused customers to become "more loyal" in the future.
  • Items featured in email campaigns caused customers to become "more loyal" in the future.
  • Items that skewed to search (paid or natural) caused customers to become "less loyal" in the future.
  • Items that were more likely to be tied to discounts/promotions were items that caused customers to become "less loyal" in the future.
Remember - we're analyzing customers who bought an item last year and determining the repurchase rate of those customers in the future - appending future repurchase back to the items customers bought last year. There's some chicken/egg stuff going on, of course (putting best items in catalogs, for instance).

Pay attention to the search finding ... Google plays a key role in influencing the future trajectory of your business. If Google brings customers who are less likely to buy in the future, and the items those customers buy become winners, then Google has mucked-up your brand ... they drive low-rebuy customers to you who like specific items that cause your merchants to offer more of those items (thereby attracting more low-rebuy customers).

Think about that for a moment - my project work shows that this dynamic is happening.


P.S.:  Facebook + Google get 75% of all digital ad dollars (click here). Your future requires you to find new customers outside of Facebook / Google / (and for catalogers, catalog co-ops).

December 04, 2018

MLV: Gift Cards

One of the offshoots of Merchandise Lifetime Value is measuring annual repurchase rates of customers who bought specific products/merchandise.

Why do we do this?

We want to understand the products/merchandise that cause customers to purchase again in the future, after controlling for historical spend at a customer level.

It turns out that there are many items that are so good and so appreciated that they cause customers to be more likely to buy in the future.

One of those items are gift cards.

Customers who are willing to spend their own money to give to another individual to buy from your brand are customers worth paying attention to.

Segment your customer file by gift card buyers (yes/no), and then measure what gift card buyers do in the future.


P.S.:  I'm old enough to remember when "Interactive Mailpiece Engagement" was simply known as "reading" (click here).

December 03, 2018

MLV: Merchandise Profile

Every item you sell has a profile.

For a company I recently analyzed, here's a sample of profile attributes for Item #1:
  • Customers who bought the item last year have a 70% chance of buying again next year.
  • 46% of the customers who bought the item last year spent at least $500 last year.
  • 41% of the customers who bought the item last year bought it via a discount/promotion.
  • 11% of the customers who bought the item last year purchased it via the call center.
  • 31% of the customers who bought the item last year purchased it online, no marketing channel attributed to the order.
  • 12% of the customers who bought the item last year purchased it via email marketing.
  • 28% of the customers who bought the item last year purchased it via search.
Here's a sample of profile attributes for Item #2:
  • Customers who bought the item last year have a 38% chance of buying again next year.
  • 13% of the customers who bought the item last year spent at least $500 last year.
  • 86% of the customers who bought the item last year bought it via a discount/promotion.
  • 9% of the customers who bought the item last year purchased it via the call center.
  • 42% of the customers who bought the item last year purchased it online, no marketing channel attributed to the order.
  • 4% of the customers who bought the item last year purchased it via email marketing.
  • 29% of the customers who bought the item last year purchased it via search.
The goal of every item we sell is to cause customers to become more loyal, and therefore, cause customers to come back and buy again.

Item #1 above does a great job of this.

Item #2 above doesn't do as good of a job as Item #1, does it?

It you have two items, and one item does a great job of fostering customer loyalty while another item harvests short-term margin dollars but does not foster customer loyalty, which item would you prefer to feature?

Oh

Click here if you cannot see the tweet below.


While that's a big problem ... that's still 3.3 million people paying attention.

And yes, I get it, you don't sell the product they sell and so you'll say that nobody wants to watch a TV show about widgets and you'll be right about that ... but there are other options ... Home Shopping Network somehow gets people to watch enough to buy a Perlier Bath & Body Set at five flexpays of $5.99 each.

Business always evolves ... there are a lot of ways to get folks to pay attention to what you are doing. You don't have to rely solely on Google, Facebook, and in cataloging the catalog co-ops. 

Do something!!


P.S.: More color on this story.


December 02, 2018

20/50 Rule

When you strip out all of online and retail demand not caused by a catalog mailing, you stumble across an interesting rule-of-thumb (yes, your mileage will vary).

Across my projects, it is common for the top 20% of catalog circulation to account for 50% of demand. In the table here, 18% of the circ yields 51% of the demand.

This ratio used to be closer to 25% yielding 50% ... it is changing over time ... the disparity is getting bigger and bigger.

It means that as catalog marketing shrinks as a discipline, the gains generated by catalog marketing are even more disproportionate ... skewed to an even smaller number of high-quality customers.

Which means that all of us are responsible for finding alternative marketing tactics for everybody else.

Make sense?

November 29, 2018

Thought You Might Like To See This

In a recent dataset, here's the percentage of new merchandise sold by marketing channel.
  • Catalog Call Center = 36% New.
  • Online = 33% New.
  • Comparison Shopping Engines = 22% New.
  • Email Marketing = 29% New.
  • Natural Search = 28% New.
  • Paid Search = 29% New.
  • Affiliates = 29% New.
  • Online Orders via Call Center = 28% New.
There's a trend here that I frequently observe:
  • Online marketing, and Google in particular, drive traffic that likes established winning products.
  • The most expensive channels (catalogs + call center) have the highest rate of new merchandise.
In a modern world, you want to align the best products with the most expensive marketing channels, so that the best product can pay the freight!

In a modern world, you want to align your new merchandise with the least expensive marketing channels (Email, Employee Influencers, Instagram/Social, Your App, Home/Landing Pages), giving them as much exposure as possible at the lowest possible cost.

Keep that in mind as you design your tactics for 2019, ok?


P.S.: The Google-thing is discouraging. Folks on Twitter tell me this is common ... that Google funnels traffic to products that "historically worked", which of course increases #engagement for Google. But that may not be what is best for you. If you don't give new merchandise enough exposure today, you won't have enough existing/winning items tomorrow.

P.P.S.: In this same analysis, the highest sales rates among winning items were in Natural Search and Paid Search. Again, Google is funneling traffic for winning items, and is not providing the same exposure for your newer items. You've got to find a way to give new items exposure at a low-cost / no-cost.

November 28, 2018

3 For The Price Of ...

That's what I see in the mailbox on Wednesday afternoon ... Pendleton sending three catalogs, all three to the wrong name (two different spellings of the wrong name, mind you).

I have about 2,493 snarky things to say about this, and none of the comments are productive, so I'll just leave the image there for your consideration.

Meanwhile Shopify tells us that 66% of Black Friday - Cyber Monday transactions on their platform were via mobile, with just 34% via desktop (click here).

Somewhere around 2005 marketing bifurcated, with e-commerce going in one direction and traditional cataloging going in another direction.

Somewhere around 2015 marketing bifurcated again, with mobile going in one direction and traditional e-commerce going in another direction.

When bifurcation happens, staffing shifts out of the channels being abandoned, toward the channels being adopted. This means that marketing responsibility is outsourced (for the incumbent channel). Oversight for accuracy is outsourced as well. Proceed with caution, ok?

Do "B" Items Become Hyper-Winning "A" Items?

In my example, using real data, here's what happened to "B" items next year.
  • 6% graduate to "A" status.
  • 58% remain in "B" status.
  • 23% slump to "C" status.
  • 4% slump to "D" status.
  • 2% slump to "F" status.
  • 7% of items are discontinued.
The key thing to analyze is the ratio of items that graduate to items that slump:
  • 6% graduate.
  • 58% remain static.
  • 36% slump or are discontinued.
So that's a problem.

Items are in a continual state of erosion.

This means we need a steady diet of new/winning items.

And you, the marketer, are in a prime position to help move new items into winning status. Do your job and give exposure to new merchandise, starting today, in low-cost channels.

Ok?

November 27, 2018

MLV - Items Eventually Slump

Here's an example from the data I analyzed ... let's look at the "best of the best" ... the top 5% of the merchandise assortment. I graded my merchandise segments A/B/C/D/F so that means the top 5% is an "A". I wanted to see what happened to "A" items in the next year. Here's what happened:
  • 71% remained at "A" status.
  • 19% dropped to "B" status.
  • 3% dropped to "C" status.
  • 1% dropped to "D" status.
  • 1% dropped to "F" status.
  • 5% were completely discontinued.
One wonders why 5% of the very best items were discontinued in the first place? There are always good reasons for this.

Only 71% of the items remained in the hyper-winning "A" segment. This means that many items begin to die. This is why new merchandise is so darn important - you have to find new items to replace the 29% of winning items (in our example) that slumped or were discontinued. Marketers are well-equipped to help facilitate this process. Go make something good happen, ok??

November 26, 2018

Merchandise Lifetime Value (MLV) - Incremental Improvement

Ok, I used my simulation model to illustrate what would happen to five-year merchandise lifetime value (MLV) if I was able to increase the number of new items in the top 55% by 10% (take items out of the bottom 45% and move them to the top 55%).
  • Base 5-Year MLV = $1,824,039 per 1,000 new items.
  • Improved 5-Year MLV = $1,971,593 per 1,000 new items.
  • Improvement = 8.1%.
If the marketer just makes a concerted effort - featuring new items in low-cost areas (email, Instagram, home page, key landing pages) ... and follows through on delivering a 10% increase in good new items ... then Merchandise Lifetime Value (MLV) increases by 8%.

The best part of this? When merchandise productivity improves, marketing gets to spend more on fun activities because those activities have a better return on investment because the merchandise the customers will purchase becomes more productive.

This isn't rocket science.

And it is so darn easy to do.

Go do it!!!!

November 25, 2018

Cyber Monday and MLV

Today the trade press will breathlessly cheer on your ability to generate a ton of volume at no profit whatsoever. "Winners" will be determined based on 50% off plus free shipping ... not based on profit that contributes to your annual bonus.

So if you have to ruin your p&l to please vendors  / trade journalists / thought leaders, at least feature new merchandise in your craven desire to make a statement by crushing the competition, ok? At least push new items into winning status, which pays off considerably in the long-term?

How much does it pay off in the long-term?

I'll talk about that tomorrow.

November 20, 2018

Merchandise Lifetime Value - MLV - Depends On First-Year Performance

Let's say that a new item performs in the bottom 45% of the assortment.
  • Five-Year Cumulative Demand = $348.
Let's say that a new item performs between the 46th percentile and the 70th percentile.
  • Five-Year Cumulative Demand = $1,569.
Let's say that a new item performs between the 71th percentile and the 85th percentile.
  • Five-Year Cumulative Demand = $4,328.
Let's say that a new item performs between the 86th percentile and the 95th percentile.
  • Five-Year Cumulative Demand = $11,380.
Let's say that a new item performs between the 96th percentile and the 100th percentile.
  • Five-Year Cumulative Demand = $35,714.
Yes, this is based on actual data I recently analyzed.

This is why it is SO IMPORTANT for the marketer to play a key role in promoting new merchandise to the customer base. Just migrating a lousy new item to the 46th - 75th percentiles results in a nearly 5x improvement in MLV.

Bumping the item up another level increases MLV by nearly 3x.

Bumping the item up another level increases MLV by nearly 2.5x.

Bumping the item up to peak winning status increases MLV by another 3x.

Now, are you ever going to get a crappy new item to become a peak winner? Absolutely not. But can you move an item up one segment, and achieve a 3x-ish MLV improvement for the item?? YES!!!! And if you do that consistently, you'll have great merchandise productivity, and that causes your marketing productivity to greatly improve - allowing you to spend more on marketing at a better ROI.

Are you against achieving better marketing ROI via giving new merchandise appropriate exposure?

November 19, 2018

Cumulative MLV

In our example, we have five years of data to analyze - and we can use that data to project MLV for a new item.

That's what I'm doing here with this graph.

After ten years, how much cumulative demand does an average new item generate?

About $2,500.

Armed with this knowledge, you can back into how many new items you need each year for your business to achieve corporate objectives.

More on the topic tomorrow.

November 18, 2018

MLV

Y'all have heard of Customer Lifetime Value (called CLV or LTV), right? Another 10% of you calculate the metric and know what the right level of customer acquisition spend truly is.

Of course, marketers focus on the metric from the perspective of the customer, and for good reason.

But what about merchandise? Is there a version of lifetime value associated with merchandise?

Of course there is!

Call it "MLV" or "Merchandise Lifetime Value". It's the amount of demand and/or gross margin dollars that can be generated by a new item over time.

It's a critically important metric, because by knowing the metric the marketer can do two things.
  1. The marketer can tell the merchandising team how many new items have to be released annually to achieve important company goals.
  2. The marketer can feature new items that are about to become winners, thereby increasing MLV ... and when MLV increases, all marketing performance increases, which means that the marketer can spend more on all of the tactics the marketer loves to execute.
Look at the image above - an average new item generates $273,000 in year one, then $511,000 in year two, then $415,000 in year three, then $342,000 in year four, and $283,000 in year five.

Of course, by year five, we don't have the same quantity of items that we started with. Items are discontinued, while a small fraction of items become winning items and those items generate a fortune.

The graph above demonstrates what a difficult year the first year is - this is when the marketer needs to step in and make sure that new items are given ample exposure so that the potential winners actually become potential winners. Too often marketers squelch new merchandise (I've done it) by not giving new merchandise enough exposure.

More on the topic tomorrow.

Items That Appear In Multi-Item Orders

In a typical Life Stage Analysis within a Merchandise Dynamics project, it is common to see exaggerated trends when comparing first-time buy...