December 30, 2015

Personalized Merchandise Assortment - An Extension of the Thesis

Here's my catalog thesis, once again:
  • Housefile names are somewhat protected by increasing organic percentages.
  • Acquisition name performance is not great, and is being impacted by a shortened "life of a catalog".
  • Math dictates that we will have to mail smaller catalogs in response.
  • Smaller catalogs generate less demand.
  • We will have to mail smaller catalogs more frequently.
  • Should the life of a catalog continue to erode, smaller catalogs will struggle to perform well, requiring us to personalize the merchandise assortment to each individual customer, based on customer history (both our history and recent co-op history).
  • In response to these trends, catalogers are going to take one of four paths (more on this to follow).
What does it mean to "personalize the merchandise assortment"?

Let's go back to our example. We moved to a 64 page piece that became, once again, profitable. Then, the life of a catalog became shorter (again), reducing productivity by 10%.
  • Demand per Book = $1.22.
  • Profit Factor = 35%.
  • Cost of Mailing = $0.45.
  • Profit = ($0.02).
To combat this challenge, catalogers will move to a "personalized merchandise assortment". The catalog will get even smaller, and the merchandise in the catalog will focus only on the merchandise the customer wants to see.

This is common in e-commerce. There, home pages and landing pages are customized based on prior purchase data, prior visitation behavior, prior overlay data, and prior referring URLs. Companies employing these strategies enjoy conversion rates that are 20% to 50% greater than a "one size fits all" strategy.

Ok, let's move from a 64 page piece to a 36 page piece, a piece that features merchandise that a specific customer likes or will like. The 36 page piece could, in theory, be different for every customer ... a plug-and-play strategy. We lose some demand going from 64 pages down to 36 ... but we enjoy a 20% productivity gain because the merchandise assortment is relevant to the recipient. Our profit and loss statement now looks like this:
  • Demand per Book = $1.16.
  • Profit Factor = 35%.
  • Cost of Mailing = $0.35.
  • Profit = $0.06.
And once again, we've kept the wheels on the bus.

This is coming, friends. And it is a positive outcome. You get to keep doing what you love doing!!

Math is sending us down this path. Simple math. Not me, not you. Math.

We will greatly reduce pages. We have no choice.

We will increase frequency. Your CFO will give you no choice.


Eventually, to prop up productivity, we will personalize the catalogs. Many catalogers won't. 

By the way, your catalog vendors are going to LOVE THIS STRATEGY. They'll LOVE IT! They will make a ton of profit when you execute a personalized merchandise assortment.

Next week, I will share with you how all of this shakes out. There are four paths that catalogers will take, in response to the math outlined this week.

December 29, 2015

The 2016 Catalog Thesis Becomes Clear

Here's an outline of what I described yesterday.
  • Housefile names are somewhat protected by increasing organic percentages.
  • Acquisition name performance is not great, and is being impacted by a shortened "life of a catalog".
  • Math dictates that we will have to mail smaller catalogs in response.
  • Smaller catalogs generate less demand.
  • We will have to mail smaller catalogs more frequently.
  • Should the life of a catalog continue to erode, smaller catalogs will struggle to perform well, requiring us to personalize the merchandise assortment to each individual customer, based on customer history (both our history and recent co-op history).
  • In response to these trends, catalogers are going to take one of four paths (more on this to follow).
Let's focus on the math.

Say you mailed a 124 page catalog once every four weeks. For a below-average housefile buyer, your productivity in 2011 looked like this:
  • Demand per Book = $2.20.
  • Profit Factor = 35%.
  • Cost of Mailing = $0.72.
  • Profit = $0.05.
But in 2016, the life of the catalog is shrinking ... the catalog is only 80% as productive as it was back in 2011. Here's what your profit and loss statement looks like:
  • Demand per Book = $1.76.
  • Profit Factor = 35%.
  • Cost of Mailing = $0.72.
  • Profit = ($0.10).
You have two choices.
  • Do not mail this customer in 2016.
  • Find a vehicle that will cause this customer to become profitable.
So, you develop a 64 page concept. The numbers change.
  • Demand per Book = $1.35.
  • Profit Factor = 35%.
  • Cost of Mailing = $0.45.
  • Profit = $0.02.
In our example, we generate 77% of the demand on 52% of the pages. Often, the percentage is between 80% and 90%, but we'll go with the lower number.

Simple math drives the decision for us. We have no choice but to head to a smaller page count.

But wait, there's a problem. You, over there, the one who looks like the CFO. What is your question/comment?
  • "The smaller catalog generates less demand. I don't like that. Mail more often, so that I do not lose sales.
You will respond by mailing two sixty-four page catalogs instead of one larger catalog.

This is how you will protect your profit and loss statement while protecting demand, in response to a shrinking life of a catalog.

Now, let's move ahead a couple of years. If the life of a catalog shrinks again, and you lose another 10% of your productivity, then the numbers change.
  • Demand per Book = $1.22.
  • Profit Factor = 35%.
  • Cost of Mailing = $0.45.
  • Profit = ($0.02).
Once again, we have a problem. And we cannot keep shrinking the size of the catalog down to zero (or could we) ... a cataloger loves to mail catalogs, so the cataloger is going to find ways to ... wait for it ... wait for it ... to keep mailing catalogs!!!!!

More on that topic, tomorrow.

December 28, 2015

Math Dictates The Response To A Shorter Catalog Life

Larger companies run page count and circulation depth simulations. The simulations allow them to understand what an optimal page count and circulation depth might look like, given different productivity levels.

Here's what your choices might have looked like a few years ago.


The red number in the profit table represents what your strategy looked like ... 1,500,000 circ depth and 128 pages. The green numbers represent optimal profit. You weren't far from optimal profit ... so things were great.

Then, the life of a catalog became shorter. Customers threw out our catalogs, quickly, shortening the effective life of any given catalog. Based on the data I'm evaluating, this results in a +/- 10% productivity hit in the past 1-2 years (mind you, the business isn't taking a 10% productivity hit ... just the catalogs are).

 Now look at what happens to our grid.


Look at the green numbers - the optimal profit numbers. Notice that optimal profit "stretches" in multiple directions. Either circ depth is shallow at high page counts, or circ depth is deep at small page counts. That's it. Those are the two choices. And you cannot prospect with a large piece, as productivity declines - you cannot circulate the larger piece to prospects - the math doesn't work.

Market forces are pushing us toward smaller, more frequent catalog mailings.

Guess what? Here's what the story looks like ... with a 50% productivity hit (hint - 2023).


Well into the future, it's low page counts with modest circ levels ... or almost no circ and large page counts ... should -50% happen to catalog productivity.

If the life of a catalog shrinks more in 2016/2017, we will be left with no choice but to mail small catalogs ... and we will have to greatly bump the productivity of the small catalogs by personalizing the merchandise assortment to each individual customer. I know, that's something that's hard for catalogers to manage ... but we'll have no choice. That's what the math tells us.

The 2016 Catalog Thesis is becoming clear.
  • Housefile names are somewhat protected by increasing organic percentages.
  • Acquisition name performance is not great, and is being impacted by a shortened "life of a catalog".
  • Math dictates that we will have to mail smaller catalogs in response.
  • Smaller catalogs generate less demand.
  • We will have to mail smaller catalogs more frequently.
  • Should the life of a catalog continue to erode, smaller catalogs will struggle to perform well, requiring us to personalize the merchandise assortment to each individual customer, based on customer history (both our history and recent co-op history).
  • In response to these trends, catalogers are going to take one of four paths (more on this to follow).

December 27, 2015

Major Catalog Trend - The Life of a Catalog is Shrinking

FYI - we're going to talk about catalogs for the next six posts - if this is not your cup of tea, no worries. If your career depends upon profitable management of a catalog marketing program at a traditional catalog brand, well, buckle up!!


This slide is from a presentation I gave, way back in 1999 at Eddie Bauer. I was trying to convince everybody/anybody that every catalog needed two versions ... one that was 180 pages sent to 1.5 million customers ... one that was 64 pages sent to an additional 2.0 million customers.

I was passionate about the topic because something interesting was happening.

  1. Business was below plan.
  2. The internet was chopping the "life" of a catalog off.
In other words, we'd measure how long a catalog generated sales. In 1996, a catalog would generate sales for 12-16 weeks. In 1999, the dynamic changed. The catalog generated sales for 10-12 weeks. The internet cut off the tail of the catalog.

Worse, the sales we'd obtain from the catalog in weeks 2-9 were less than we'd historically measured. Weeks 0-1 seemed ok, then the catalog would sort of die off.

When this happened, the dynamics of a catalog business changed.
  1. The online channel captured the sales that were cut off from the tail of the catalog, but the catalog did not cause the online sales to happen. This is the "organic percentage" I've talked about for nearly a decade.
  2. The 180 page catalog was much, much less profitable.
  3. For 70% of the file receiving a catalog, a smaller catalog ... 64 pages ... became more profitable than a larger catalog (180 pages).
When the life of a catalog shrinks, the catalog becomes less productive.

When a catalog becomes less productive, you have to make one of two choices.
  1. Reduce circulation.
  2. Reduce pages.
Now - read what Bill LaPierre had to say a while back (click here). Go down to the "changing patterns" paragraph. Read that paragraph.

I get to analyze a lot of mail/holdout tests. I measure the incremental demand generated by a mailing, by week. Over the past two years, there is a clear dynamic at play:
  • The life of a catalog is shrinking.
This is one of the reasons why your co-op names are not performing well. You used to generate $1.30 per catalog ... but now the tail is being cut off catalogs, shortening the realistic life of the catalog down to 2-4 weeks, in so many cases. This lowers the dollar-per-book down to $1.10 or $1.00 (or $0.50 for many of you) on co-op catalogs. 

Again. Go look at the incremental difference between your mailed group and your holdout group. This tells you what the realistic life of a catalog is. In many cases, the life of a catalog is down to 2-4 weeks. Look at your matchback results for co-op names, and you'll observe similar trends.

Now, if your customer is 70+ years old, this doesn't really apply to you - the rules of modern marketing do not apply to you.

If your customer is between 50 and 65 years old, this is about to become the story of 2016.

When the life of a catalog shrinks, page counts shrink - they have to shrink in order to maintain circulation depth.

When page counts shrink, demand shrinks. To make up lost demand, smaller page count mailings are mailed more often.

In the next five posts, I'll describe which of four paths a cataloger is likely to take, in response to a shrinking life of a catalog.

December 23, 2015

Merry Christmas!

For those of you reading this blog via an email subscription (about 35% of you), you may notice that the ads are gone.

I spent $160 to get rid of the ads. It's my way of saying "Merry Christmas" to you! We'll try this for a year and see how it goes.

Merry Christmas!

December 22, 2015

The Prospect List

Can I share something with you?


Now, I get it ... if you are a $1,000,000 business catering to an 18-39 year old audience, social media means everything. But if you are a $100,000,000 cataloger catering to a 63 year old customer, well, social media is meaningless.

But put that discussion aside for a moment.

In the slide above, Zara has more than 7 million followers on Instagram. That's the very definition of a prospect list. Zara has permission to share imagery and imagination with the prospect list.

Let's assume you are a cataloger (I know, many of you aren't). What is your prospect list? In other words, what is the list that you get to market to, that you have permission to market to?

I know how my business works.
  • 100,000 uniques read at least one blog post per year.
  • 50,000 - 100,000 unique individuals see 1+ tweet a month.
  • 5,700 follow on Twitter.
  • 2,500 subscribe to the blog.
  • 850 subscribe to the blog via email.
  • 1,000+ uniques have listened to at least one podcast.
  • 15 - 40 companies hire me for a project in any given year.
In other words, I have a really big prospect list. And it is not easy to build a prospect list. Not easy at all. It is hard work, work with minimal rewards on a daily basis but huge rewards over time.

Back to your business, as a catalog brand. What is your prospect list? If your prospect list cannot be accessed unless you give a gatekeeper $0.06 per prospect, you have a problem. If your version of a prospect list is the rental of email addresses (while your e-commerce competitors easily collect email addresses from non-purchasers for free), you have a problem.


December 21, 2015

Project Pricing For 2016

Are you looking to understand if your merchandising team is holding back your brand (or turbocharging it)?

Do you want a full diagnostic analysis of your business, at a comp segment level, to determine if new or existing products are hurting your brand?

Do you need a full scoring of your catalog customer file, a scoring process that yields $1,000,000 of annual profit per $100,000,000 business?

Are you ready to sign up for the new "Hillstrom's Loyalty" product?

Are you a Private Equity brand looking to purchase a catalog brand and want to know if the business is healthy or not?

December 20, 2015

A New Product Offering: Hillstrom's Loyalty!!

There is a clear customer acquisition problem in 2015. Coupled with the merchandise productivity problems identified in 2013 and 2014, it is obvious that we have a loyalty issue and a customer acquisition issue.

Both are issues. Woo-hoo!

Oh. Wait. That's not good news.

When both are issues, we have a profit problem, don't we?

So let's try something in 2016. Let's create a new product that addresses the loyalty issue, the customer acquisition issue, and the growing desire of you (the reader) asking me to visit your campus.

Given your feedback, here's the product. I will call the product "Hillstrom's Loyalty", though the product really addresses both loyalty and customer acquisition.

Cost:
  • Existing Elite Members = $9,500 (client pays travel expenses).
  • All Other Businesses = $14,500 (client pays travel expenses).
What do you get?
  1. A comp segment analysis to measure merchandise productivity.
  2. A model that grades housefile customers A/B/C/D/F, with A/B customers deemed "loyal" (i.e. 60% or greater annual repurchase rate). I will measure how your loyal customer base has changed over time. Are you truly growing your loyal customer base, given everything you've done to foster customer loyalty?
  3. A spreadsheet model that shows the five-year trajectory of your business based on current/historical customer acquisition trends. The spreadsheet will quickly diagnose if you have a customer acquisition problem or not.
  4. A one day site visit where I will present my findings, where we will go over your customer acquisition tactics/strategies, and where you can ask me any question you wish to ask me.
Tell you what ... I'll make this even more interesting ... for the first three companies who sign up in the next forty-eight hours, I will offer this at an introductory price of $8,999. After the first three companies sign up (by end of day Wednesday 12/23), the pricing model above holds.

These slots will go very, very quickly.

Email me right now (kevinh@minethatdata.com) to get one of the three slots.

A Nagging Trend

Twenty years ago, Christmas sales happened between mid-October and early-December.

Ten years ago, innovations in shipping and handling allowed customers to receive merchandise right up to within 2-3 days of Christmas. Customers reacted accordingly, delaying purchases. This freaked businesses out, because it created doubt ... as orders shifted later and later, businesses didn't know if they were struggling with a forecasting error or a demand shortfall. As a result, discounts and promotions weren't offered to stimulate demand, but instead, were offered to mitigate inventory positions. It's never good to develop a marketing promotional strategy based on inventory positions.

Today, the customer knows that merchandise featured at 20% off in early November and at 25% off on Thanksgiving and at 30% off on Cyber Monday and at 40% off on December 21 will be 70% off for the two weeks following Christmas. As a result, the customer waits, and for good reason. This trend makes it look like there is an inventory problem, further fueling discounts and promotions and fear. Lots and lots of fear. Worse yet, the customer can give a gift card, allowing the recipient to buy merchandise after Christmas at 70% off. Any business school would tell you that's not a smart way to generate profit.

When viewed over twenty years, we've taken full-price sales from October 20 - November 20, and traded them in for 30% off sales in late November and gift cards in December and 70% off sale periods after Christmas.

We mushed-up the profit and loss statement. By being able to accurately forecast demand (a lost art), we can get out of this profit spiral, this nagging trend. We have the ability to fix this problem. Go fix it!

December 17, 2015

Catalog Craig and Digital Dan

It's a discussion including Catalog Craig Paperman and Digital Dan Disruption. Yes, this is fiction. If this isn't your cup of tea, try viewing updates to my big presentation on customer acquisition (click here).


Kevin: I suppose you are wondering why I called you all here today?

Catalog Craig: I hope this is a short meeting. I am busy paginating catalogs for Fall 2016 and cannot be delayed.

Digital Dan: You are paginating ... wait, what?

Catalog Craig: We're planning for Fall 2016. 

Digital Dan: That's crazy.

Catalog Craig: How else do you know what is going to be featured on page 74 of the November Remail II catalog, due in-home on November 29, 2016?

Digital Dan: Who has time to do that? We have to read the results of our optimization test this morning, and then change what we feature on key landing pages this afternoon.

Catalog Craig: Wait. What?

Digital Dan: I know, I know, we're old school. Some say we focus too much on the desktop/laptop experience.

Catalog Craig: Did you just say you tested something this morning, with the intention of acting upon the test this afternoon?

Digital Dan: Again, we're old school. We should be reacting in real time. But at least we're moving forward. It's a data-driven world, and we're a small piece in the Big Data puzzle.

Catalog Craig: I agree with the data-driven thesis. We apply our square inch analysis to make sure that the remail of the remail of the November catalog is perfectly merchandised.

Digital Dan: You mail the same catalog three times?

Catalog Craig: With three different covers. You have to spice things up, make the customer experience as engaging as possible.

Digital Dan: And you are spending time on December 18, 2015 to plan a catalog that will mail in eleven months?

Catalog Craig: We like to think we are a disciplined organization.

Digital Dan: What are you doing to drive sales today, this afternoon?

Catalog Craig: That work happened months ago. Today, we sit back and measure hourly sales against our projections. Now, to be fair, we altered our projections three times this week.

Digital Dan: So you spent your valuable time altering the precision of your sales measurements?

Catalog Craig: How else are we going to improve forecast accuracy?

Digital Dan: We're going to blow past our forecast this afternoon, once we adjust the website after analyzing the results of our morning website test.

Catalog Craig: You don't care about forecast accuracy?

Digital Dan: We care about driving sales.

Catalog Craig: But if you grow sales among items that are nearly sold out, you will sell out, and then you will disappoint customers.

Digital Dan: We feature items online that are not close to selling out.

Catalog Craig: See, we can't do that. We can only feature items online that are aligned with the catalog that is currently in-home.

Digital Dan: Why?

Catalog Craig: Because the customer demands an integrated experience across channels.

Digital Dan: Did you execute an online survey to learn that fact?

Catalog Craig: No, we read an article in a trade journal. The article was written by a vendor that sells solutions that require an integrated experience across channels, but I wouldn't let that fact bias a sound strategy.

Digital Dan: We are optimizing in near-real-time because we attended a conference and a vendor presenter said that's how you grow.

Catalog Craig: Does the vendor optimize in real-time?

Digital Dan: No.

Catalog Craig: Why not?

Digital Dan: The vendor said the rules are different in B2B, so they don't have to use the solutions they sell to us.

Catalog Craig: Fascinating.

Digital Dan: Same thing with Google. They told us how magical digital was, so we moved all of our marketing spend into the digital realm. They said offline marketing was unaccountable.

Catalog Craig: I saw a billboard for Google in Downtown London earlier this year.

Digital Dan: You did?

Catalog Craig: And I saw a TV commercial for Android.

Digital Dan: You did?

Catalog Craig: Seems like Google chased you out of the offline world so that more eyeballs would focus on unaccountable marketing while you spent your digital dollars with Google.

Digital Dan: But we're spending digital dollars in real time!

Catalog Craig: How do you know that all of your real time optimization is best for your business, long-term?

Digital Dan: Huh?

Catalog Craig: I assume you measure the long-term impact of all of your real-time digital initiatives, right?

Digital Dan: Huh?

Catalog Craig: For instance, the changes you make to the website this afternoon, those changes will impact the long-term trajectory of your business. You thoroughly understand the long-term impact of these changes, or you wouldn't make the changes, right?

Digital Dan: We A/B tested. "B" won. "B" was best. End of story.

Catalog Craig: That's why we plan our catalogs eleven months ahead of time. We want to make sure we control our future. You let "B" win. Maybe "Q" was best?

Digital Dan: "Q"?

Catalog Craig: Your future is determined by limited A/B testing based on short-term results. You never get to "Q" because you only theorize around A and B.

Digital Dan: But what you are doing is less efficient. Planning eleven months out. That's crazy talk.

Catalog Craig: In the short-term, yes.

Digital Dan: Our A/B tests guarantee that we are more efficient.

Catalog Craig: In the short-term, yes.

Digital Dan: You are just saying that because you don't want to go to all the effort and discipline required to perform the A/B tests we perform each day.

Catalog Craig: True.

Digital Dan: See!

Catalog Craig: But you still have no idea if what you are doing is right for your business in the long-term, or if you just end up with an e-commerce version of Buzzfeed.

Digital Dan: And you have no idea whether your eleven-month planning cycle is right for your business, or if you just end up with a modern version of Montgomery Wards.

Kevin: Enough. I'm bored.

Catalog Craig: But who is right?

Kevin: You are both right. And you are both wrong. That's the magic of business.

Digital Dan: But we never got to personalization, relevancy, and engagement. I have so much more to say.

Catalog Craig: And I never got to talk about the power of paper arriving in a mail box. Ohhhhhh ... paper.

Kevin: We're done!


Now, if you didn't like reading a fictional argument that didn't solve anything but should serve as a metaphor for your experiences, then give the updated version of this presentation a read-through (click below if you do not see the presentation box):

December 16, 2015

It Needs To Be Shared Again

I shared this fact a few days ago ...

Profit per customer is highest among recent, high frequency buyers. That's something we all know.

But profit, in total, comes from areas where we have profitable customers in large quantities. In this case, it happens among recent buyers who are early in the customer life cycle. There are so many customers there generating average profit that, in reality, this is where the biggest profit improvement can happen.

Conventional wisdom suggests you should take care of your best customers.

Actual data suggests that there's nothing wrong with taking care of your best customers, but the opportunity is small. The real opportunity is to find new customers at a low cost, and then nurture those customers in the 1-3 months following a first, second, and third purchase. That's where all the real profit is generated, "at scale" as folks like to say.

There is a process of managing a customer base that we don't think often about. That process looks something like this:


December 15, 2015

Map It!! Impact of Weather on Sales

This map is for a business that analyzed the impact of the "Polar Vortex" a couple of years ago. Results were mixed - red = gains, blue = losses. The map shows no weather impact whatsoever.

Remember the "Polar Vortex"? Folks said that it was so cold that it impacted shopping. Or it was so cold that it helped shopping. Either way, you could use the "Polar Vortex" as an excuse or as a blessing.

You have the data to prove whether "weather" impacts your business or not. In particular, this December, you have a test/control group. West of the Rockies, weather has been warm and cold, wet in areas, dry in other areas. East of the Mississippi - warm!

So map your results vs. last year. It's simple! Just map the results. You'll know within minutes what impact weather has on your business.

P.S.: Don't have the software to run this analysis? I'll run it for you ... $499 today only ... take advantage!

December 14, 2015

How Your Customer Base Behaves - Follow the Numbers

We're going to go through a series of images today. The images help us understand how our customer bases actually behave. Your mileage may vary.

Look at this image. This is the amount of demand a customer will spend in the next year, based on customer recency/frequency. As you can see, at a customer level, high future spend happens among customers with 15+ life-to-date purchases (orange/red colors). Duh!

Here's annual marketing cost per customer.

The picture isn't different, is it? This company spends a ton of marketing dollars, per customer, on customers who have purchased 5+ times.

Here is profit per customer.

Again, the story is similar. High profit levels come from customers who have purchased 15+ times, in this case.

Again, we all know this to be true.

But what if we change the way we evaluate the information? In other words, what happens if we look at totals instead of per-customer metrics? How does the story change?

Here are the number of customers in each recency/frequency segment.

The story is about to change, isn't it? There aren't many high-value customers. Many of the customers have purchased 3 months ago or 15 months ago (in this example ... clearly indicating seasonal buying habits). The vast majority of customers have purchased just one or two times.

Here is total annual demand (demand in the next twelve months), by recency/frequency combination.

Most of the next year's demand comes from customers with 0-5 months of recency, and within that cohort, from customers with 1-15 purchases. 

Here is total marketing cost.

Again, a ton of marketing dollars are focused on recent, low-frequency customers ... because this is the place where most of the customer base exists.

Here is total annual variable profit.

Heavy profit volume comes from recent low-frequency and recency high-frequency customers.

At a customer level, we like to focus on recent, high-frequency shoppers. We work terribly hard to get these customers to become even more loyal ... we'll give away merchandise (discounts/promotions) and erode profit to accomplish the goal.

But if I were the CFO of a company, I'd look at these images, and I'd challenge the marketing team to develop relevant tactics for recent buyers who are early in the customer life stage. This is where the volume of demand/profit is greatest, because the volume of customers is greatest.

Pay attention to recent, infrequent shoppers. This is where the annual success of a company is determined ... companies that convert these customers at low cost have a huge advantage over everybody else. Think carefully - what is your marketing program for moving a 2 month, 2x buyer to 3x status? Don't say "we send email campaigns" or "we send catalogs" or "20% off plus free shipping" ... you do those things across your customer base. What is the specific program designed to move the 2 month 2x buyer to 3x status, now?

December 13, 2015

There Are So Few "Great" Customers!

This is a typical story ... we have time across the x-axis, and we have customer quality across the y-axis. The colors? That's how much customers spend in the next ten days.

Almost the entire twelve-month file can be expected (in this case) to spend less than $9 in the next ten days (it's usually much worse than this). Only the top 5% of the file spends a robust amount of money.

You'll see comparable trends in your data. No doubt about it. There are a ton of infrequent buyers who just aren't going to spend much, no matter what you do. Identify their organic percentage ... measure it. If it is high (> 50%), why pummel those customers with marketing?

Interestingly, the very best customers often have the highest organic percentages ... exceeding 90% in many of my projects. However, because these customers are so valuable, 10% of $50 is $5, and that's more than a customer with a 50% organic percentage and $8 of future value (0.50 * $8 = $4). As a result, best customers are pummeled with marketing offers, aren't they?

The secret to business is finding ways to profitably manage the 75% of the twelve-month buyer file that will purchase infrequently.

Impact of Weather on Sales


December 10, 2015

Impact of Search on New / Infrequent Buyers

Take a look at this one ... for a business, this is the percentage of annual demand that comes from search (all search).
In the past year, this file consistently demonstrates predictable trends ... the top 20% of the file is least likely to purchase via search (< 10%) ... the middle of the file (15% to 50%) spend north of 15% of their demand via search. Often, this trend is more extreme, with the bottom of the file skewing heavily to search.

We can also compare year-over-year demand changes within search.

9-12 months ago, customers were spending > 20% more on search than the year prior. But as the year progressed, customer spend in search declined, across the board, and in the past month, year-over-year trends turned negative.

When I see this, I need to dig into the data with the marketing folks. Did they change marketing spend on search (i.e. less)? Did their vendor change their bidding strategy? Or is this a sign that search ... a driver of demand among infrequent (and new) buyers ... is beginning to fail. If search is beginning to fail, what does that mean to the ability of the brand to acquire new buyers?

From 2016 - 2020, the biggest story we're dealing with is finding low-cost new customers ... it's getting harder and harder. Here, we see an example where search helps the bottom of the file, and year-over-year demand volume from search is on the decline. Somebody needs to dig in and research what is happening here, don't you think?

Closing In On 6,000 Views

The presentation on Customer Acquisition, a version of which will be shared at the VT/NH Conference in March, has been viewed nearly 6,000 times in the past month. Take a look at how the slides have evolved, and please send me feedback (kevinh@minethatdata.com) (click on the link below if you cannot see it).


I worked with a business that implemented the tactics in this presentation, and grew their business by 20% over their baseline performance within 30 days ... thirty days! Name one catalog industry vendor who has been able to grow your sales by 20% within one month?

Send me your thoughts (kevinh@minethatdata.com). What do you want to see? What should I research over the next three months? Where am I off base? Where do I need to dig deeper? Let me know your thoughts.

December 09, 2015

Who Buys New Items?

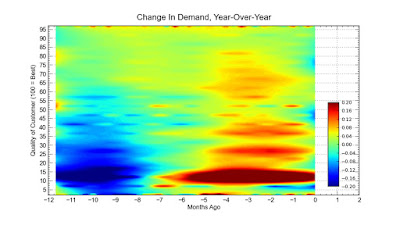
Ok, the style of this image below will take a bit of explaining, and I'm sure the measurement folks and graphic experts will tell you to never look at anything I share because it violates best practices ... but it doesn't matter what the graph looks like, it matters if the information is actionable. Right?

On the graph below, the "x-axis" is time ... from 12 months ago to today, in 10 day increments. The "y-axis" is the quality of a 12-month buyer, from low quality (0) to high quality (100). The colors represent the share of demand from items introduced in the past year.

What do you see?

Look at the bottom of the buyer file ... the bottom 25% for instance ... about 25% of what they purchase is new items.

Look at the top of the buyer file ... the top 15% for instance ... about 15% of what they purchase is new items.

You run this analysis for your business, right? You know whether new items are preferred by your best customers or by marginal buyers? Your merchandising strategy for prospecting and search and affiliates and comparison shopping engines depends upon your knowledge of this information.

Now look at what is happening in the past two months (months = -2, -1, 0). The share of demand coming from new items is declining, and it is declining across the board. Something changed.

I ran this table - showing year-over-year change in demand from new items ... x/y axes are the same.

This is interesting. From four months ago to one month ago, customers (across the board) spent more on new items than a year prior - this reversed a lousy trend from 7 - 12 months ago. Clearly, the merchandising team put their foot on the new merchandise gas pedal, and customers liked what they saw, across the board!

But in the past month, year-over-year demand from new items stabilized. The gains are gone, and there is evidence that the top 80% of the twelve-month buyer file are spending less on new items.

For comparison purposes, let's look at the same trends for existing merchandise.

The top of the file exhibits mostly consistent trends on existing items during the past year.

The bottom of the file spent less on existing items 9-12 months ago ... then spent much more on existing items over the past six months, on average.

Let's add new and existing items together. What do we see?

This is a business that experienced tepid performance 9-12 months ago ... because the bottom of the file was struggling ... whereas the top of the customer file held firm. The bottom of the file likes new merchandise more than the top of the file ... and this was a timeframe when new merchandise struggled to perform well.

Between 1 and 4 months ago, the business experienced productivity gains across the board. This aligns with the improved productivity of new items during that timeframe.

And notice the strong signal among segments of marginal customers (10th to 15th percentile). When I see this, I usually observe a marketing tactic that was applied to a specific set of customer segments.

In this example, new items drove productivity gains across the board 1-4 months ago, and new items drove productivity declines among marginal customers 7-12 months ago. Existing item productivity was more consistent, especially across better customers. Existing customers tend to prefer existing items, marginal customers tend to prefer new items (in this case). This allows us to understand that any wobbly behavior in the business is due to inconsistency in new merchandise offerings.

The biggest challenge we have from 2016 - 2020 is to find new customers in a cost effective way. We'd prefer free tactics, too, right? Well, dig into your merchandise assortment. What do new/infrequent buyers like to purchase? Why not get that stuff out in front of those customers? Take advantage of what you control, stuff that doesn't cost you anything.

Seasonality as a Reactivation Opportunity

Remember this image from a week-and-a-half ago? Remember the peaks at 11/12/13 ... 23/24/25 ... 35/36/37 months since a first purchase? Thos...