November 30, 2020

The Rancho Gordo Bean Club

You probably saw the story on CBS Sunday Morning (click here).

11,000 Club Members.

11,000 on the Waiting List.

The secret over the past two years seems to be an exclusive subscriber list that you treat better than your average customer / prospect.

Makes me think about my own business ... hmmmmmmm ... what ideas do you have for your business (or mine)??!!

November 29, 2020

Does The COVID-Bump Help You In 2022?

If you are a restaurant in Los Angeles, you don't get a COVID-Bump. You get to be closed, with no assistance from anybody. Good luck!!

But if you are a direct-to-consumer e-commerce brand not selling apparel, you might still be benefiting from a massive COVID-Bump, fueled mostly by new customers. You are stunned by what has happened in 2020. What will likely be 400,000 deaths and millions of hospitalizations netted you +50% or +100% sales gains. As I was told earlier this fall ... "I'm torn between feeling awful for society and feeling blessed because my company is performing well and I have a job."

What is the question I'm asked to analyze most often this Fall?

  • "What does the COVID-Bump mean for my business in 2022?"
The answer is a simple one. If your Annual Repurchase Rate is under 40%, the benefit of the COVID-Bump evaporates quickly, giving you a small sales increase in 2022 and nothing thereafter.

If your Annual Repurchase Rate is greater than 50%, well, it's a whole different world. You get to enjoy the magic of Compound Interest for several years. God smiled upon your business model.

For any business, however, 2021 is a "setup year". It's like in baseball when you have a 4-2 lead in the 8th inning. You bring in your setup relief pitcher. It is his job to bridge the gap between the 7th inning and the 9th inning, when you bring your closer in to finish off the game. If you want 2022 to be as successful as possible, you need to set up 2021 to be as successful as possible.

  • Until there is a vaccine, keep your foot on the Customer Acquisition gas pedal.
  • Welcome Program ... Welcome Program ... Welcome Program. Convert customers to a second purchase IMMEDIATELY. This is non-negotiable, and if your Marketing Leader tells you that you do not need a Welcome Program, go find another resource to do this for you.
  • Keep the customer clicking via email marketing.
  • If you have print, separate out those who need print to purchase from everybody else, and only spend money/resources on customers who need print to purchase.
Use 2021 as your "bridge year" ... so that you are as ready for a "New Future" in 2022 as you can be. Customer behavior is likely to fundamentally change and not go back to where it was. Why not influence customer behavior as much as possible in 2021 so that you play an active role in creating the future you need to create?

November 27, 2020

Tony Hsieh

Certainly you've heard the news by now ... maybe not from the trade industry, but if you are on Twitter the outpouring of support was unavoidable for the founder of Zappos (click here).

Mr. Hsieh was an early reader of this blog. When you are getting started in this business, it's helpful to have a somebody read what a nobody has to say.

Mr. Hsieh was one of four people (Don Libey, Ben Chestnut of MailChimp, Robert Kestnbaum are the other three) who thought differently in a way that shaped how I viewed things. Three of the four are gone now. Make sure you appreciate those you think highly of. Say something to them while they are still here.

Do you have examples of individuals in our industry that have shaped how you view the world? Share those individuals with our audience ... pass me a note and I'll publish credible responses.


P.S.:  If you are a cataloger, read up on the stuff that Robert/Kate Kestnbaum wrote about in the 1990s. They used math 25-30 years ago that was smarter than the math you are using today. Hint - their math forms the basis of the catalog optimization work I perform today.

P.P.S.:  If you love email marketing, read what Ben Chestnut has to say. Also notice that he didn't choose to dominate email marketing ... he helped small businesses be excellent at email marketing, and that difficult choice made all the difference.

P.P.P.S:  Don Libey taught me how to run a consulting business as an independent consultant. He gave away his knowledge, for free. He's largely the reason that the work I perform is mostly shared ... for free ... via this blog.

November 24, 2020

New Buyers From Here On Out

Most of my project work shows two important facts (yes, there are exceptions):

  1. It is easy to acquire customers from Thanksgiving through Christmas.
  2. Customers acquired between Thanksgiving and Christmas have the worst long-term value.
This is such a challenging balancing act. In general, we don't have the tools to convert the Christmas buyer into a Jan/Feb/Mar/Apr buyer. Heck, the customer doesn't want to be converted.

Most digital marketing analytics packages don't tell you that the Christmas newbie doesn't want to buy again ... software is designed to tell you who converts, not who will convert again.

Tag all of the first-time buyers you acquire over the next five weeks, and watch them going forward. You're going to see the problem in Spring. Then you'll want to develop a credible Welcome Program to solve the problem for Spring 2022.


November 23, 2020

Virgil Carter

It's a lot easier in Sports to see how strategy evolves over time than it is to see how strategy evolves in Business. Sports is measured in terms of wins, losses, and Championships. As a consequence, good strategies tend to be moved into the future, where they are evolved. In business, some of the best strategies I've seen are buried in small businesses that never evolve or change, and as a consequence those strategies never see the light of day.

This brings me to the story of Virgil Carter. Virgil was a Statistics Major at BYU, and he was a good college Quarterback. In the NFL, Mr. Carter had a weak arm, so the Cincinnati Bengals had to develop an offense that would suit what he did well (he released the ball quickly and was an accurate thrower). Who was his offensive coordinator? Well, it was none other than Bill Walsh, who won multiple Super Bowls with the San Francisco 49ers in the 1980s. Bill Walsh developed what became known as the "West Coast Offense" to suit Mr. Carter's skills, then evolved the offense to a comprehensive "system" for running a football organization. Heck, Mr. Walsh wrote a book with a limited number of copies on how to run a football organization. I bought one of the copies on eBay for $$$ ... if you carefully look at the bookshelf of any NFL coach, you might just see one of the copies.


Back to Virgil Carter.

Remember when I told you that Mr. Carter was a statistician? Well, it turns out that Mr. Carter also contributed to the future of football by analyzing the outcome of plays (click here). He learned how many expected points you would generate if you took over possession of the ball at your own 33 yard line, for instance.

So Virgil Carter played two key roles in the evolution of football.

  1. His limitations (weak arm) led to the development of the West Coast offense and short-passing game, which took advantage of his strengths (accuracy, smarts). This offense eventually branched into two different directions ... one developed by Andy Reid for his MVP quarterback (Patrick Mahomes) ... and one that was evolved by Mike Shanahan (for John Elway) that was further evolved into the offenses currently run by the San Francisco 49ers, Los Angeles Rams, and Green Bay Packers (among others).
  2. His college major (statistics) led him to develop his own version of "expected points" ... which ultimately became "advanced analytics" that are employed all across football today. You'll see "expected points" used repeatedly as teams now routinely go for it on, say, 4th and goal at the one yard line (expected points = 3.5 with a 50% chance of scoring a touchdown and a 50% chance of failing, greater than the 3.0 points you'll get for kicking an easy field goal). 
By next September - November, a vaccine will be prevalent enough to help us return to a "new normal".

And when that happens, the next "Virgil Carter" will have spent the prior year developing a methodology for how to adapt a business in a post-COVID world. That person will have an enormous head start over everybody else ... a huge competitive advantage that will be difficult to overcome.

Why can't that person be you?

November 22, 2020

Opting Out

Last week was fun ... I wrote about risk ... and close to 1% of subscribers opted-out, citing that "CONTENT IS NO LONGER RELEVANT".

I've always judged that when many people unsubscribe because CONTENT IS NO LONGER RELEVANT that I am headed down the right path. I lost a ton of subscribers back in 2013 when I started talking about the importance of merchandise performance ... then I generated more annual revenue over the next three years than during any other three year period ... because you (the loyal reader) hired me to analyze merchandise performance.

I've learned a lot about the audience over the past fourteen years. A key finding is that the audience tends to want very specific answers to very specific questions. If I write about general topics that relate to general questions, the audience rebels.

In recent years, a fraction of the audience has become more combative. These individuals want very specific answers to very specific questions ... and more important, they want to ARGUE about specific answers. The arguing is the end result that "some" readers seem to embrace ... sort of like in politics. The reader can "appear" smart by arguing a small fact in a large argument, without ever having to apply any smarts to a challenging business situation.

I had one subscriber who was with me for several years. This person held a C-Level position with a company that was headed toward bankruptcy. This person always argued ... he wasn't mean (he was very kind to be honest, I assume a very good person), but he was always nitpicking 5% of an argument in an effort to invalidate 100% of an argument. He was quite good at this. I can't imagine how frustrating it would have been to work for this individual. Worse, he had answers to every specific argument you could imagine ("here are four reasons why Amazon will not take over e-commerce") but didn't have a single argument for solving the problem at hand ... that being, of course, the fact that his own company was headed into bankruptcy. 

His company went bankrupt.

You didn't opt out last week ... I know that because you are still reading today's post. That means you are at least somewhat open-minded to different concepts. Frequently I develop ideas as a stream-of-thought over several days/weeks, and those ideas infrequently become products that eventually help your business. That's how I use this blog. I use it to develop concepts. I'm not trying to provide a specific answer to a specific question. I'm trying to hover a level or two above specific answers to specific questions. If I do that successfully, your business performance can improve.


P.S.: Speaking of highly specific answers, here is an example of what I am talking about, one that everybody can form an opinion of (click here). This is what so many readers want ... a highly specific solution that everybody can "weigh in on".


November 19, 2020

Profit and Risk

I promised you I'd share how variable profit is under normal circumstances.


10% of the time profit will be below $2.0 million.

25% of the time profit will be below $2.3 million.

50% of the time profit will be around $2.8 million.

25% of the time profit will be above $3.2 million.

10% of the time profit will be above $3.6 million.

Our CFO ... she's not going to be pleased with profit numbers that could vary between $2.0 million and $3.6 million.

But this is what we're dealing with when we craft a plan. We do all of this work, hard work, to produce a certain outcome. But the outcome is not certain. The outcome is highly variable. I mean, half the time profit could be between $2.3 million and $3.2 million. And the other half of the time? It's an outcome more variable than that.

And that's under normal circumstances.

Every one of you is dealing with a business that has that kind of variability. Your estimates for what "will" happen next year are filled with risk, filled with variability.

Then you layer COVID on top of it.

It's going to be darn important to communicate risk to people. Unbelievers. Folks who think because a spreadsheet says you will generate $62,000,000 means you are promising to deliver $62,000,000. In a normal year you could not make that promise, though you've done so for a long time. In 2021? You are facing more risk than you've faced since 2020.

A flexible and adjustable plan, one where you clearly communicate a range of possible outcomes ... that's what is needed in 2021.


November 18, 2020

Putting Together the Puzzle

Yesterday I shared a high level sales plan, one where we figured out that our business would generate $28.2 million in sales and $2.6 million in profit.

Is the plan something we can take to the bank?

Well, you have the "bottom's up" crowd that estimates a business plan based on individual segment performance in marketing campaigns. It's a lot of work, and it isn't any more accurate than doing the simple calculation I performed yesterday. I know this because I spent a decade building plans at Eddie Bauer & Nordstrom and have the scars to prove my point.

The plan, of course, is subject to a lot of variability.

For instance, over the past five years, annual rebuy rates have varied as follows for this brand:

  • 36%.
  • 34%.
  • 38%.
  • 35%.
  • 37%.
In Excel, it's easy to calculate the mean & standard deviation:
  • Mean = 36%.
  • Standard Deviation = 0.016.
If results are normally distributed (and they usually are), this tells us something about the variability around rebuy rates.


That's the outcome of 10,000 simulations of rebuy rate, given how rebuy rates have varied over the past five years.

We perform the same exercise for other key metrics ... rebuy rate, spend per repurchaser, new + reactivated buyers, spend per new/reactivated buyer.

For each of 10,000 simulated outcomes, we calculate projected net sales, and we calculate projected profit. Here is the histogram for projected net sales.

Oh oh.

Based on a normal range of results from prior years, we observe quite a range of possible outcomes, don't we?
  • 10% of the time, net sales will be under $26.5 million.
  • 25% of the time, net sales will be under $27.4 million.
  • 50% of the time, net sales will be +/- $28.5 million.
  • 25% of the time, net sales will be above $29.6 million.
  • 10% of the time, net sales will be above $30.6 million.
Honestly, in our business, that's not a lot of variability.

But for your CFO, that is WAY TOO MUCH VARIABILITY.

Now imagine having to layer in the impact of COVID on top of those numbers.

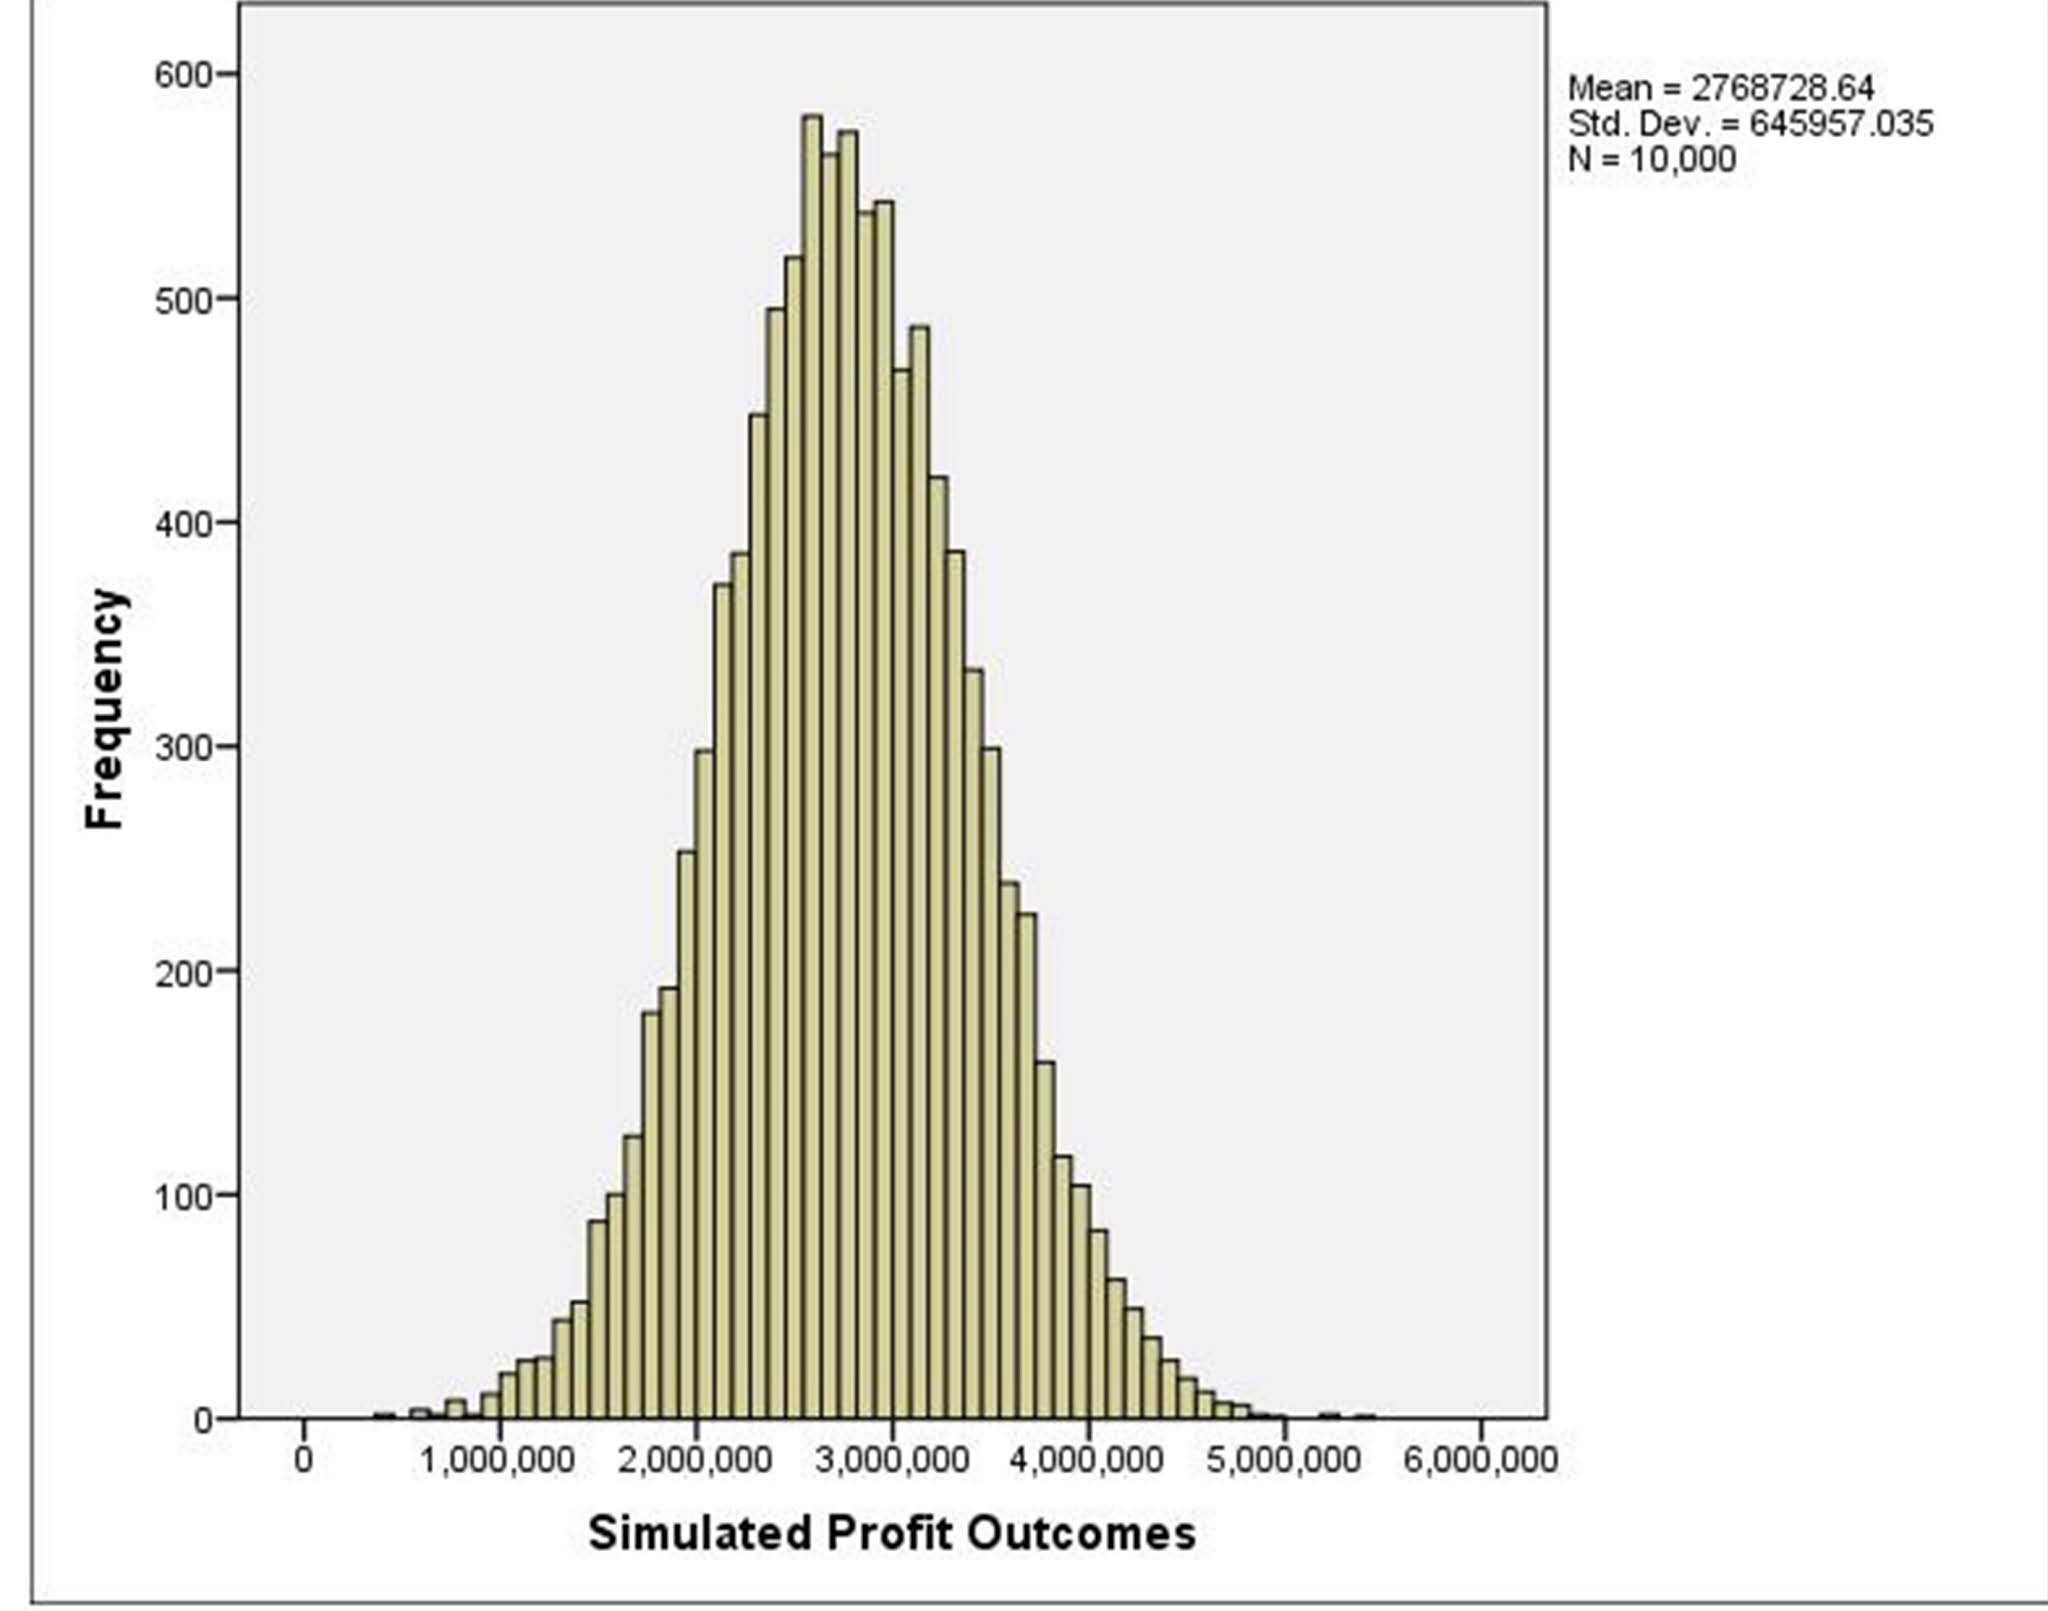
Tomorrow I'll share with you what profit looks like for our business.


November 17, 2020

Is My Plan Risky?

You start with a high-level plan for the upcoming year, based on actual data from the year prior. This is a common-sense approach to planning, one that so darn many companies use.

12 Month Buyers:

  • 200,000 buyers, 36% repurchase rate, $160 spend per repurchaser.
  • 200,000 * 0.36 * 160 = $11,520,000 sales next year.
New + Reactivated Buyers:

  • 130,000 New/Reactivated buyers, $128 spend per purchaser.
  • 130,000 * 128 = $16,640,000 sales next year.
Total Volume:
  • $11,520,000 + $16,640,000 = $28,160,000 sales next year.
Other Metrics:
  • 40% of sales flow-through to profit.
  • Expected Ad Cost expenditure = $5,632,000.
  • Expected Fixed Costs = $3,000,000.
Expected Earnings Before Taxes Next Year:
  • $28,160,000 * 0.40 - $5,632,000 - $3,000,000 = $2,632,000.
  • 2,632,000 / 28,160,000 = 9.3% of Net Sales.
Is your plan "risky"?

In other words, you are signing up for $2,632,000 profit on net sales of $28,160,000. How likely is it that your "promise" will happen? Could you end up with a lot more in sales? A lot less? And how would that impact profit?

Tomorrow I'll show you how variable forecast "could" be.

November 16, 2020

Communicating Risk

Remember yesterday, when I shared that something you pencil out in a spreadsheet as a "good decision" is actually a decision that has risk? In my example, what appeared to be a profitable decision actually had a 23% chance of being unprofitable.


Here's the biggest reason people don't evaluate risk. It is "risky" to communicate risk.

I worked for a person who took a few stat classes in college and therefore thought he was a brilliant statistician. When I communicated risk to him, he got uncomfortable, then he got angry, then he misinterpreted what he learned in his three stat courses, then he said things that were completely wrong but said them as if he were right so anybody in his orbit took his side, causing everybody in the room to be wrong.

What did he misunderstand about risk?

He believed that the "average" outcome was a "certain" outcome.

And if actual results came in "below average", well, that was your fault.

And if actual results came in "above average", well, that was because the merchant was brilliant.

I learned to NEVER communicate a probability to this person, because this person was incapable of understanding probabilities. He'd have been a terrible Texas Hold 'em player and a really sore loser if he had to deal with a "bad beat" on the river.

Instead, I sandbagged everything.

I never submitted a business plan assuming an "average" outcome. I'd calculate the probability of a less-than-optimal outcomes, then submit a less-than-optimal outcome. Business would then "hopefully" perform at an average level, in which case my plan would be exceeded, and everybody would be happy ... including my boss who didn't (couldn't) understand probability and risk.

It's awfully hard to properly communicate risk to individuals who struggle with assessing risk. Come up with a strategy that mitigates the downside while promoting an upside that makes people happy.


November 15, 2020

Decisions and Risk

You have a paid search program, and you expect the program to deliver the following metrics this month:

  • Conversion Rate of 1.5%.
  • Average Order Value of $90.
  • Average Cost per Click = $0.50.
  • Profit Flow-Through = 40%.
  • Expected Profit = 0.015 * 90 * 0.40 - $0.50 = $0.04.
You tell your agency that all efforts need to break-even. The data suggests that given the metrics, you should make a few pennies per click, on average.

But how much "risk" is there in that situation?

Here's the result of a 10,000 simulated runs, runs where I apply variability surrounding the conversion rate.


On average, you are generating $0.04 of profit per click ... but the amount of profit could vary between a loss of $0.10 and a profit of $0.17 in most cases. In fact, you'll lose money 23% of the time. In other words, even though your plan suggests that you should make money, 23% of the time you will not make money.

If you were told that your decisions needed to be profitable, would you make a decision that will lose money 23% of the time?

Almost every reader out here fails to perform this style of analysis.

But every reader out here SHOULD perform this style of analysis. All decisions have some sort of risk tied to 'em. At minimum, you need to understand how much risk surrounds your decision.


November 12, 2020

Testing Budget

Earlier in the week, I mentioned that I used to negotiate with the CEO of the Online Division at Nordstrom for my testing budget.

In other words, we had a discussion each year, and we pre-agreed upon the sales/profit impact of my tests.

I recall in 2003 that the budget was set at 3% of sales. For a $350,000,000 division, this was roughly $10,000,000 in sales and $3,000,000 profit. The CEO was willing to lose $3,000,000 profit because what was learned in executing the tests was worth $3,000,000 profit.

If you do your job as a Virtual Chief Performance Officer properly, you'll generate enough downstream profit to more than make up what you lose executing the tests.

Do you have a testing budget?

Odds are 90% of you don't have a testing budget, and that says something about your historical ability to prove that what you learn from testing has long-term value.

For instance, the testing budget at Nordstrom was what we used to determine that catalogs (via holdout tests) generated no incremental profit to the company ... which allowed us to allocate $36,000,000 of ad-cost to other activities ... half to paid search ... which generated a profit ... which caused our online sales to increase when we pulled all that paper out of the ecosystem. The testing budget (where we were willing to lose $3,000,000 profit per year to learn) allowed us to learn enough to make tens of millions of dollars of profit.

That's what you can accomplish as a Virtual Chief Performance Officer ... implementing a simple testing budget and a credible testing plan and a communication plan for the results of your tests.

November 11, 2020

-188 + 192*x

It was 1991 at Lands' End. We were greatly ramping-up our testing work. And when we wanted to execute a test, we needed to understand how the results might "vary".

Back then, a test was sampled from the population who would receive a catalog. Maybe that audience was 4,000,000 customers. If the catalog was a productive catalog, it might generate $10.00 per catalog mailed. If the catalog wasn't productive, circulation would be reduced and the catalog might generate $4.00 per catalog mailed.

If you want to measure a 10% difference in sales for two groups performing around $4.00 per book, you need fewer customers than if you are trying to measure at 10% difference in sales for two groups performing around $10.00 per book. This is an issue called "heteroscedasticity".

So I built an equation that measured variability around different dollar-per-book estimates. The equation was a simple one:

  • -188 + 192*(Expected Dollar per Book).
If we expected one group to generate $4.00 per book and the control group to generate $3.60 per book, we'd calculate the variability at point estimate:
  • $4.00 = -188 + $192*4.00 = 580.
  • $3.60 = -188 + $192*3.60 = 503.
Then we'd enter the data into our statistical equation.
  • (4.00 - 3.60) / SQRT(580/25000 + 503/25000).
  • T = 1.92.
As long as T > 2.00, we would execute the test with the sample size promoted by the equation.

In this case, the sample size was too small, so we had to increase it.

  • (4.00 - 3.60) / SQRT(580/30000 + 503/30000).
  • T = 2.11.
You probably already have a calculator that you enjoy using. If not, contact me and we'll get something set up for you for your data at minimal cost (kevinh@minethatdata.com).

November 10, 2020

But I Cannot Afford THAT Many Customers

This is the part of the discussion where the Virtual Chief Performance Officer hears the grumbles, from near and far.

  • "We cannot afford to test THAT many customers!"
You can't afford NOT to test THAT many customers.

When I worked at Nordstrom, the Online CEO and I had to negotiate the size of the "testing budget". I needed a lot of customers, he needed a lot of sales, and he needed to learn things. So compromises had to be met.

I'd pull out a graph that looked something like this (don't worry about the y-axis at this time ... worry about where it is high vs. where it is low).


If we only sampled 10% of the audience, we had a lot of sampling error ... and that meant we'd never be certain we had the "right" answer.

If we sampled 40% of the audience, we had minimal sampling error ... and that meant we'd likely have the right answer but would give up a lot of sales to learn the right answer.

So we'd agree that "x" percent of the population was appropriate for how much we wanted to learn vs. the amount of sales/profit we were willing to pay to learn the information.

That's what we're talking about:
  • How much profit are you willing to pay in order to learn something about your business?
For too many of you, the answer is $0. You're not willing to pay anything to learn.

And as a result, you don't learn anything.

It costs money to learn something. You already know this, you attended college, right? So as a 20 year old, you were willing to pay something to learn. But as a seasoned 40 year old Professional, you're not willing to pay anything to learn. Hmmmmmm.

Be willing to pay something to learn something.

November 09, 2020

Lots of Variability

Yesterday I showed you what happens when you sample 25% of customers from a full population with a known outcome ($14.42 per customer, average) ... you end up with noise.


That's what happens when you aren't dealing with the entire population.

What happens when you deal with an even smaller fraction of the original population? Look at the x-axis and compare the values in the histogram to the image above.


Oh oh.

Notice that the overall average is "similar" ($14.32 sampling 5% of customers vs. $14.39 sampling 25% of customers vs. sampling 100% of customers and getting $14.42).

But the spread is huge!

Huge!

Some of the outcomes are around $13.75 ... and you CANNOT know if that outcome is the real outcome or a blip due to sampling variability. One of the outcomes was > $15.50 and you cannot know if that outcome is the real outcome or a blip due to sampling variability.

Look at the standard deviation metric ... 0.412 ... so much higher than the 0.113 we saw when sampling 25% of the original population. It means that your results will vary by +/- $0.82 instead of +/- $0.23.

The Virtual Chief Performance Officer has a job ... and that job is to STEER YOU AWAY from situations where you are measuring something with +/- $0.82 of variability ... steering you toward outcomes that are within +/- $0.23 of expectations.

Here's the problem we all face. We're told we're supposed to TEST outcomes, aren't we? You are supposed to be "data-driven".

But if you are "data-driven" and you make one little mistake ... testing without enough cases to test properly, well, you provide your company with GARBAGE, don't you?

This sin happens repeatedly in business. Smart data-centric folks making bad choices, not understanding variability, creating chaos in a company and then defending the chaos.

The Virtual Chief Performance Officer steps the company away from these situations. We'll talk more about these situations tomorrow.


November 08, 2020

Variability

One of the jobs of a Virtual Chief Performance Officer is to teach the concept of "variability" to employees ... and especially Executives.

In business, things don't happen on a predictable basis. There is always noise. ALWAYS! The real world is noisy too ... look at polling errors (again) associated with the Election.

Allow me to show you an example. Here is performance for twelve-month buyers in the next month. On average, customers spent $14.42 in the next month.

  • Most spent $0.
  • Some spent $50.
  • Some spent $100.
  • Some spent $500.
  • Average = $14.42.
Let's conduct a little experiment here. I ran 30 samples from this audience. I randomly sampled 25% of the customers in this audience, measured the average spend in the next month, and then plotted a histogram of the distribution. Here is the histogram.

Most of the results are "similar" to an average of $14.42 ... but aren't exactly $14.42, are they? This is the definition of "sampling error". We sample from the original population, but the results don't end up EXACTLY like the original population. We have differences.

A Professional has to be able to deal with these differences. You will never know if the actual result ($14.42) actually happens. Sometimes you take a sample and you get $14.20 ... it's technically the same as $14.42 because it is drawn from the same population, but the observed outcome IS NOT THE SAME and you cannot ever know that it is not the same.

In this case the standard deviation is 0.113 ... so you can expect most of your results to vary by between +/- $0.23. If you get a result of $14.20 ... it might actually be $13.97 or it might actually be $14.43 (remember, the actual observed outcome was $14.42) and you don't know what direction your estimate is off by.

Tomorrow I'll show you what happens when you only sample 5% of the population instead of 25%.


November 05, 2020

A Side Effect of the COVID-bump

Is this what your COVID-bump looks like, when measured via a Comp Segment analysis?


If so, you've probably performed some advanced analytics (or hired somebody like me to perform them), and you may have observed an interesting side-effect of the COVID-bump.

  • Sales of items selling at/above their historical average price are increasing dramatically.
  • Sales of items selling below their historical average price are flat.
This is a fabulous outcome, of course ... it means that your sales just flow-through to profit at a very high rate.

A COVID-bump provides pricing integrity. Ask folks who produced toilet paper in Spring about pricing integrity. Pricing integrity leads to long-term profitability. Take advantage of the pricing integrity you may have earned via a COVID-bump, and you may have a more successful 2021-2022.


November 04, 2020

Trust

For the third of the audience who reads my content and tends to be catalog-centric, you have two delivery-centric vendors who will need to re-establish trust with you going forward. 

  • USPS.
  • FedEx.
One pushes your marketing to the customer.

One delivers your merchandise to the customer.

Both are now an obstacle to your success.

FedEx (you've told me this) spent months telling you to sub-optimize your business so THEY can optimize their business. Here is a recent story (click here).

And if the USPS is stopping delivery of some mail-in votes (right or wrong), how do they convince you that they ever ... ever ... actually did what was right for your business?

Institutions eventually break. When they break, something is lost ... then something new is created. You get to decide what is created. Get busy creating, ok?

November 03, 2020

New Customers Don't Know That Old Merchandise Is Old Merchandise

This fact keeps popping up, folks.

If you have a COVID-bump ...


... then you need to dig into the stuff that is driving your COVID-bump (click here for your customized project).

Like existing merchandise. A lot of the customers driven by the COVID-bump are coming from search. Within search, Google sure seems to like pushing prospects toward existing items, long-term winners that Google has a significant history "analyzing". When I look at what COVID-bump customers are buying, it's the stuff that has always worked. And why not? New customers don't know that existing merchandise is the stuff that has always worked. So if it has always worked, the numbers "optimize" and you end up preserving your assortment one cycle longer than you expected to preserve it.

Be careful analyzing new merchandise during the COVID-era. What works in October / November 2020 "could" work next year ... but we don't really know that, do we? Your experience, knowledge, and imagination are going to go a long way toward projecting a future assortment.

And for some of you, the fact that new customers don't know that old merchandise is old merchandise is an important finding that has practical (and profitable) ramifications for your future.


November 02, 2020

An Interesting COVID-Based Trend

We know what a COVID-bump looks like, via Comp Segment analytics.


We also talk frequently about the "organic percentage" ... the share of orders that happen without the aid of marketing.

Here was a trend for one company:

  • November 1, 2018 = 55%.
  • May 1, 2019 = 58%.
  • November 1, 2019 = 62%.
  • March 1, 2020 = 64%.
So this brand is getting healthier by the minute .... orders are consistently happening without the aid of marketing, and at increasing rates.

Then we look within the COVID-bump:
  • April 1, 2020 = 63%.
  • May 1, 2020 = 64%.
  • June 1, 2020 = 61%.
  • July 1, 2020 = 59%.
  • August 1, 2020 = 58%.
  • September 1, 2020 = 58%.
  • October 1, 2020 = 57%.

This is what a SMART MARKETING DEPARTMENT looks like.

Why would I say that?

Well, it is obvious that the marketers figured out in April/May that "something" was going on. They read the Comp Segment tea leaves properly, and they put their foot on the marketing gas pedal, spending money to amplify a highly positive trend.

You leverage your business experience to understand what is happening behind the scenes. Behind the scenes at this company, somebody was trying very hard to amplify a positive trend. These are the kind of clients (or companies) you want to work with. They're trying hard to make things better.


November 01, 2020

What Does A COVID-Bump Look Like?

It's not hard to see it ... this is what it looks like across my client work, using my Comp Segment framework (you know how to calculate Comp Segment performance, right?):


If "normal" is +3%, we'll set the axis at +5%. Then in March we see a +5% comp, followed by a nice comp in April and a bonkers comp in May. From there, comps slowly begin to reset closer to normal. For the April - September timeframe, the average comp is +27%. That's what a COVID-bump looks like. Normal performance (+3%) becomes +27%, and the bump has a natural peak and then cools off.

Of course, if the maskless Midwest continues to burn down, then there may be additional restrictions, and those restrictions might inspire another COVID-bump. So we don't know what is going to happen. We do know we can use our Comp Segment framework to measure what is happening, and act accordingly.


Items That Appear In Multi-Item Orders

In a typical Life Stage Analysis within a Merchandise Dynamics project, it is common to see exaggerated trends when comparing first-time buy...