Helping CEOs Understand How Customers Interact With Advertising, Products, Brands, and Channels
March 23, 2023
The DTC Index - And Giving Away Free Information
March 22, 2023
An Interconnected Business
We've talked about your Category Development situation as being similar to a solar system ... you have a Star, you have Planets that rotate around the Star, you have Moons that rotate around Planets, you have Asteroid Belts (broken categories), and you have Comets that infrequently interact with your solar system (i.e. Gifts at Christmas).
In other words, your business is interconnected.
And when you fail in one category, you impact other categories.
If your Star category struggles, the struggles spill over into all other categories.
If a Planet category struggles, the Moons will struggle.
If a Comet category struggles? Meh.
But make no mistake. Your business is interconnected, and you are doing things that greatly help or hurt other categories.
March 21, 2023
Price / Customer Tradeoff
When you are developing categories, you likely look at your cost of goods and determine a price that (theoretically) delivers enough profit to fuel your business into the future.
On average (your mileage will vary), when prices increase, customers decrease. The goal (on the surface) is to increase sales as prices increase ... you trade off a few customers but the math all works out.
Here's what you are hoping to accomplish.
- Last Year = 1,000 customers buying 1.4 units per customer at $50 each = $70,000.
- Next Year = 800 customers buying 1.3 units per customer at $70 each = $72,800.
- Sales Increase = 4%.
March 20, 2023
Three Ways To Grow
Rank-ordered by what you read about from the experts.
- Get more sales from loyal buyers.
- Acquire new customers.
- Manage your merchandise assortment properly.
- Acquire new customers.
- Get more sales from loyal buyers.
March 19, 2023
How Many New Items?
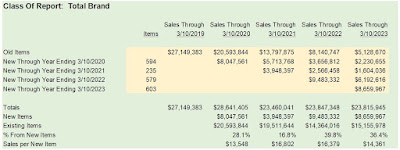
Ok, here's our table.
There is a relationship hidden in the table.
- 594 items = $8.0 million in new item sales.
- 235 items = $3.9 million in new item sales.
- 579 items = $9.5 million in new item sales.
- 603 items = $8.7 million in new item sales.
Here we have our friendly law of diminishing returns ... it appears practically everywhere once you know how to look for it.
March 16, 2023
What Harms You Today Harms You Tomorrow
We learned yesterday that the Class Of 3/10/2021 was too small, and didn't generate enough sales, costing this business five million dollars in the year ending 3/10/2021.
Did you notice that the business never recovers from this problem?
New items recover quickly. Somebody noticed that the merchants nuked the business, and as a consequence new items perform at $9.5 million the following year ... recovering by about $5.5 million dollars. However, the total business does not recover ... sales increase by a paltry $0.4 million.
How can that be?
Two things are happening here.
First ... new items today become existing items tomorrow. Read across the year ending 3/10/2021 row. $3.9 million in year one becomes just $2.6 million in year two. In the class of 3/10/2020, $8.0 million in year one becomes $5.7 million in year two. In other words, this brand loses $5.7 million - $2.6 million = $3.1 million in sales in the second year because the merchants failed the year prior.
Each merchandise class has a "life" ... and if you don't have enough new items one year you won't have enough existing items the following year.
That's the first issue.
The second issue? This is a completely different issue. Look at the top row. These are older items, items that have been around for more than four years. Look at how sales drop off year-over-year. These items gave up $6.6 million in the year ending 3/10/2020, they gave up $6.8 million in the year ending 3/10/2021, they gave up $5.6 million in the year ending 3/10/2022, and they gave up $3.0 million in the year ending 3/10/2023.
In other words, items at this company have a moderate life cycle (in terms of length), and each year you need to come up with enough new items to cover the losses you experience from long-term existing items. If you don't generate enough new items, you hurt your new item performance AND you fail to compensate for items that are aging.
You can use this analysis technique to measure how many new items you "might" need next year to protect the future of your business. When you know the decay rate of existing items you can back into how many new items you likely need to keep your business moving forward.
March 15, 2023
Problem Spotted!
Back to our table:
Look at the row titled "New Through Year Ending 3/10/2021".
That "class" had just 235 new items, compared to 594/579 in the years before/after it.
This merchandise class was small, and it did not generate sufficient sales. In the first year, this "class" generated $3.9 million in sales, a lot less than the years before/after it ($8.0 million, $9.5 million).
Look at total sales for the year ending 3/10/2021 ... there is a five million dollar top-line hit compared to the year prior.
This business was nuked by a merchandising team that failed to give proper importance to finding new items that work. Some might say "well, we had supply chain issues" and sure, that's a problem. But it doesn't solve the problem of the business being harmed.
Notice that this business doesn't recover, with sales down for each of the two subsequent years. More on this topic tomorrow.
March 14, 2023
Can You Spot The Problem?
Though this seldom happen in actual project work with actual clients, there are times when I receive emails or tweets that share this theme:
- "You seem to oversimplify everything. Business really doesn't come down to new customers and new merchandise."
Each year there is a new merchandise class. Those items sell for several years before being discontinued and/or sales decline.
March 13, 2023
The "Class Of" Report
March 12, 2023
Silicon Valley Bank
I don't have any insider information, sorry. Here's an article to help you learn a bit more.
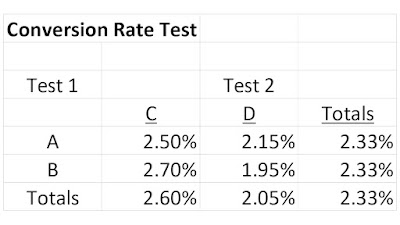
Business Professionals struggle with feedback loops. Feedback loops are cousins of interactions. Here is an example of an interaction. This is a 2x2 factorial test on conversion rates.
Here we see that the interaction of B/C produces the best result. A test of this nature identifies the interaction we should pay attention to.
Now, what would happen "A" was your control and you tested A vs. B? The results would be identical, and you'd conclude to keep doing "A" and you'd never realize that A with B works best.
In our world of A/B testing, we miss interactions all the time. Interactions lead to unique outcomes, and unique outcomes can lead to feedback loops that can either accelerate results or harm our businesses.
I wrote this more than eight years ago for catalog readers (click here). Here we are in 2023 with constant grumbling about how hard it is to find new customers in large enough quantities. With an inability to measure and understand interactions between Amazon and online brands and catalog brands (all of which could have been disclosed by the co-ops but they'd have seen that as bad for their clients), my catalog clients suffered mightily, and continue to suffer.
In the case of Silicon Valley Bank, you saw what the interaction of risk (which likely wasn't as huge as it was on many/most bank failures) did when multiplied by insider Silicon Valley folks pulling money early multiplied by commoners pulling money late leading to the failure of the bank.
Where possible, develop your skills at identifying interactions. It's a critically important business skill to acquire.
March 09, 2023
Retail Stores
Here's a quote I now use on Twitter.
- "A store is a purpose-built structure designed to extract money from customers and prospects who want to be there."
March 08, 2023
Odd Quirks in Category Targeting Models
Here's one of the odd quirks you find when creating Category Targeting Models. This brand has twelve (12) main categories. When I decile my findings, I see oddities. Look at this customer (decile 10 is best, decile 1 is worst).
- Category 01 = 10.
- Category 02 = 10.
- Category 03 = 10.
- Category 04 = 8.
- Category 05 = 10.
- Category 06 = 10.
- Category 07 = 10.
- Category 08 = 10.
- Category 09 = 10.
- Category 10 = 10.
- Category 11 = 10.
- Category 12 = 10.
- Category 01 = 2.
- Category 02 = 2.
- Category 03 = 3.
- Category 04 = 4.
- Category 05 = 2.
- Category 06 = 4.
- Category 07 = 4.
- Category 08 = 2.
- Category 09 = 2.
- Category 10 = 7.
- Category 11 = 2.
- Category 12 = 2.
March 07, 2023
Category Targeting Model Framework
I've explained this previously, and the statisticians in the studio audience are going to belly-ache about what I'm about to explain, but here's what I do ... I'm transparent about my methodologies.
Step 1: Select twelve-month buyers as of 12 months ago.
Step 2: Calculate historical spend in 0-12, 13-24, 25-36, and 37-48 month buckets.
Step 3: Calculate future spend in the next twelve-months.
Step 4: Regress the four variables in Step 2 against the dependent variable in Step 3.
Step 5: Evaluate the coefficients for the 0-12 month spend variable, 13-24 month spend variable, 25-36 month spend variable, and the 37-48 month spend variable. Let's pretend that they are as follows ... 0.604 ... 0.369 ... 0.235 ... 0.134. Divide each value by the value of the 0-12 month coefficient (0.604), giving us 1.000, 0.611, 0.389, 0.222.
We now have our weights ... we weight 0-12 month dollars by 100%, we weight 13-24 month dollars by 61%, we weight 25-36 month dollars by 39%, and we weight 37-48 month dollars by 22%.
Step 6: For each category, we calculate weighted dollars spent during the past four years, as of one year ago.
Step 7: For each category, we calculate total dollars spent in the past year.
Step 8: We run a regression for each category ... the independent variables are weighted dollars spent in each category, the dependent variable is amount spent in the past year for a specific category. This way, we learn which categories contribute to future spend within a specific category.
Step 9: We repeat Step 2, shifting our date ranges one year forward.
Step 10: We score each customer for each category for the next year.
Step 11: If desired, results are placed into deciles for each category.
At this point, you have completed Category Target Modeling ... you now have targeting variables for every category. If you wish to send an email campaign to Mens Outerwear customers, you use the Mens Outerwear Category Targeting Model results.
Again - statisticians are gonna grumble about the methodology. Let them come up with their own ... this methodology is simple and effective and proven to work in the real world.
P.S.: Yes, you can use logistic regression here as well with a 1/0 dependent variable. Works well.
March 06, 2023
Category Targeting Models
If you want to develop your categories, you'll need two things.
- A style/sku plan to properly manage winning items, new items, and existing items.
- A marketing plan to target merchandise to customers most likely to purchase from various categories.
March 05, 2023
Loyalty Program Expectations
There is a reason so many retail brands tie loyalty programs to credit programs. The goal isn't necessarily to increase customer spend - the goal is to increase the amount of interest charged to a customer.
In my work, it is generally true (your mileage will vary) that loyalty programs increase customer spend by around 10%, plus/minus.
For a loyalty program to work, you need high value customers. Pretend you have a typical e-commerce customer with a 30% chance of buying again, purchasing 1.6 times at $100 each if the customer repurchases.
- Normal Conditions = 0.30 * 1.6 * 100 = $48.00 of expected spend next year.
- Loyalty Program = 10% Bump = $48.00 * 0.10 = $4.80.
- Normal Conditions = 0.70 * 5.00 * 100 = $350.00 of expected spend next year.
- Loyalty Program = 10% Bump = $350.00 * 0.10 = $35.00.
March 02, 2023
Statistical Significance of A/B Tests
There is a ton of misinformation out there about A/B testing. Those lacking rigorous statistical training tell you that you need "x" responses for a valid A/B test.
That's not how this stuff works.
More than thirty years ago (Lands' End), we developed an equation to estimate the variance associated with our A/B mailing tests. It turned out that the variance of our estimates was non-constant. In other words, the variance might be "x" when the dollar-per-book was $3.00 ... it might be "1.5x" at a dollar per book of $5.00.
We developed an equation ... as long as dollars-per-book was >= $2.00 variance could be estimated as -188 + 192*x, where "x" was the dollars-per-book in a test group (aside ... there are going to be statistical experts who balk at creating this equation ... one that accounts for non-constant variance ... and will say that everything that follows is garbage ... just want you to know that view is out there, I need to be forthright here).
Let's pretend that our control dollar-per-book was $3.00, and we expected the test dollar-per-book to be $3.25. Let's pretend that we wanted 10,000 customers in the test group and 10,000 customers in the control group. Would our results be statistically significant?
The t-test equation looked like this:
- Test Group Dollar-Per-Book = $3.25.
- Control Group Dollar-Per-Book = $2.75.
- Test Group Sample Size = 10,000.
- Control Group Sample Size = 10,000.
- Variance of Test Group = -188 + 192*3.25 = 436.
- Variance of Control Group = -188 + 192*3.00 = 388.
- T-Score = (3.25 - 3.00) / SQRT(436/10000 + 388/10000) = (0.25) / (0.29) = 0.86.
- T-Score = (3.25 - 3.00) / SQRT(436/100000 + 388/100000) = (0.25) / (0.09) = 2.78.
March 01, 2023
There Goes Google ... A Channel All By Itself
- 7.8% of sales were derived from one specific Category.
- 20.4% of all sales attributed to Google were from this category.
- 75% of sales attributed to Google were from first-time buyers.
The DTC Index - And Giving Away Free Information
You read this and subscribe to this newsletter, correct (click here) ? Pay attention to what the author says about Marginal aMER. In my simu...

-
It is time to find a few smart individuals in the world of e-mail analytics and data mining! And honestly, what follows is a dataset that y...
-
As is my tradition, I'm going to take a long weekend. No posts until early next week. I've been doing this for almost twenty years, ...
-
Sometimes you think "people already know this stuff". Sometimes you realize that Google Analytics give smart analysts almost no op...