September 28, 2017

2 Days Left To Join!!

You still have time to join this run!!

Our #subscription based program continues to evolve. With this run, I am going to shift focus just a bit.

Here's what you will get:
  • Your standard comp segment analysis.
  • Your standard comp new + reactivated analysis.
  • A continuation of a handful of rolling twelve month metrics.
  • Your annual repurchase and file composition table.
Here's two new things added for this run:
  • A "grid" that illustrates where changes in your customer file generate the most "leverage" ... similar to stuff we've been talking about over the past two weeks.
  • Rolling Price Point Information ... one of the biggest problems I've observed in 2017 projects is that changes in price point strategy (i.e. making items more / less expensive) is generally hurting businesses. We'll explore how price point changes are impacting your business.
Cost?
  • First-Time Participants = $1,800.
  • Existing Participants = $1,000.
Contact me right now (kevinh@minethatdata.com) to join the program and for file requirements.

Key Dates:
  • Payment is due by October 10, 2017.
  • Data is due by October 15, 2017.
  • Analysis will be received by October 31, 2017.

P.S.:  E-commerce is more about merchandising than technology (click here). Also notice in that article that Nike calls Amazon "soulless" ... speaking of soulless, the Feds subpoena Nike's elite basketball program (click here). Choose your partners carefully.

September 27, 2017

Sierra Trading Post: They're Doing Something

I didn't expect this to pop up on my TV screen this evening:


This is a company with a strong catalog heritage (click here) ... sure they're not an independently operated cataloger, but as you know, that's a dying breed. Catalogers (and increasingly e-commerce brands ... my how things have changed on that side of the aisle) have to pick their path.
  • Find a Partner.
  • Find a Buyer.
  • Do it Yourself, Low-Cost / No-Cost Customer Acquisition.
  • Do it Yourself, Pay Tolls.
I keep getting tactical questions ... "68 pages vs. 64" ... ". The time for tactical questions is over. It's time to do something.

P.S.: I'm not saying that their TV ads are going to make a bit of difference. They may make 'em a fortune, or they may be feckless. It doesn't matter. They are doing something.

P.P.S.:  Yes, you are correct ... you saw what I was watching ...

Then The Business Really Takes Off!

Here is our base case:


And here is what happens when new merchandise productivity improves to flat performance - notice that demand from new items does not grow.


And here is what happens when new merchandise productivity increases by $30,000 per month.


New merchandise no longer declines ... and existing items sizzle. The improved assortment appears to generate cross-shopping activity that benefits existing items.

These relationships exist in every business. Frequently, new merchandise performance is a catalyst that fuels the rest of the business.

And yes, when we multiply our forecasts out month-after-month, we get errors similar to the spaghetti plot used by hurricane forecasters.

But we at least get to see what "can" happen ... and that's pretty important ... in both hurricane forecasting and in e-commerce.

Contact me (kevinh@minethatdata.com) if you want a comparable analysis run for your business!

September 26, 2017

What Happens When New Merchandise Productivity Flattens Out?

Here is the base forecast for the business we are analyzing.


The forecast demonstrates that declining new merchandise productivity is a problem.

What does the forecast look like when new merchandise productivity flattens out?


Two things stand out:
  1. New item demand does not grow ... there is negative momentum that has been slowed, but not stopped. We're going to need a productivity improvement in new items to fuel new item growth.
  2. Stopping the new item productivity slide, however, caused existing items to sell better ... up to $144,195,740 from $132,257,778.
Now, these forecasts are subject to the same issues that the "spaghetti plots" are for hurricane forecasts "x" days out. Errors tend to pile on top of each other, and the forecasts become more and more erratic.

But our modeling process suggests something important:
  • If we want existing items to sell well, we need to improve new item productivity.
Tomorrow, I'll run a forecast showing what is needed to get new merchandise totals to grow again.


P.S.:  On Monday, I talked about the four paths we'll take as we move into the future.

  • Find a Partner.
  • Find a Buyer.
  • Do it Yourself, Low-Cost / No-Cost Customer Acquisition.
  • Do it Yourself, Pay Tolls.
So read this ditty (click here). Where does this fall on the continuum? And what business cannot make money on $3,000 a square foot? I have retail clients earning $150 a square foot and they're making money. You can try clever stuff ... but for crying out loud, get the CFO involved early on, ok?

September 25, 2017

Impact of New Items

When a hurricane is out in the ocean, meteorologists produce what are called "spaghetti plots" that indicate possible trajectories of the storm. This was Irma a week +/- before landfall. 


By varying initial conditions and running the simulation out in time, meteorologists get to see who might be in danger. As you can tell, there was a reasonable probability that the hurricane would hit Florida. The hurricane eventually hit Florida.

In e-commerce, comparable techniques can be applied. I like to use a time-series modeling process incorporating lags and current merchandise productivity. I'll spare you the math ... if you want to see the math, send me an email (kevinh@minethatdata.com) and I'll share the technique with you.

Here's the forecast for new/existing items, showing past year trends (black), monthly merchandise productivity (red), and future projections (green).


Each month, this company is losing nearly $28,000 of demand from new items ... in other words, new merchandise productivity is poor. Each month, this company is gaining $106,000 of demand from existing items ... in other words, existing merchandise productivity is good!

Here is the equation for the forecast for next month's new merchandise rolling twelve month total:
  • 94167 + 0.988*Lag(New Item Demand) + 1.566*(Monthly New Item Productivity).
Here is the equation for the forecast for next month's exiting merchandise rolling twelve month total:
  • -56,920,972 + 1.348*Lag(Existing Item Demand) + 3.470*(Monthly Existing Item Productivity) + 0.953*Lag(New Item Demand).
There are two important findings that we can derive from the equations.
  • New Merchandise is not impacted by Existing Merchandise.
  • When New Merchandise Productivity Improves, Existing Merchandise Sells Better.
Tomorrow, we'll investigate what happens when new merchandise productivity flattens out (instead of the current trend of negative performance).


P.S.: Yesterday I spoke of 4 options you'll have going forward.
  • Find a Partner.
  • Find a Buyer.
  • Do it Yourself, Low-Cost / No-Cost Customer Acquisition.
  • Do it Yourself, Pay Tolls.
So read this ditty about Levi's (click here). Where does this tactic fall on the continuum?

September 24, 2017

When It's Over


An era ended in 2017 ... when it's over, something new begins. As we head to 2018, e-commerce and cataloging are going in four different directions.
  1. Find a Partner (think Kohl's taking returns from Amazon).
  2. Find a Buyer (think Wal-Mart buying companies like ModCloth or the QVC empire or Catalog Holding Companies).
  3. Do it Yourself (with low-cost / no-cost customer acquisition programs and new merchandise brilliance ... think Duluth Trading Company).
  4. Do it Yourself (tied to Google / Facebook and for catalogers the catalog co-ops ... and too often, this is the outcome - click here).
Yes, we get to pick the path we want to take. I've promoted (3), through there's nothing wrong with (1) (2) (3). But make no mistake, in 2017 folks began choosing their dance partners ... choosing too late in 2018 defaults you to (4), and you don't want to be there, now do you?

My most popular project in July - September has been my Seller / Private Equity Evaluation (click here). It's obvious what is happening as we head into 2018. If you want to know if you should pursue (1) (2) (3) (4) (5) above, send me and email (kevinh@minethatdata.com) and we'll get started figuring out what your customer file is capable of supporting, ok?

September 21, 2017

9 More Days To Join!!

You still have time to join this run!!

Our #subscription based program continues to evolve. With this run, I am going to shift focus just a bit.

Here's what you will get:
  • Your standard comp segment analysis.
  • Your standard comp new + reactivated analysis.
  • A continuation of a handful of rolling twelve month metrics.
  • Your annual repurchase and file composition table.
Here's two new things added for this run:
  • A "grid" that illustrates where changes in your customer file generate the most "leverage" ... similar to stuff we've been talking about over the past two weeks.
  • Rolling Price Point Information ... one of the biggest problems I've observed in 2017 projects is that changes in price point strategy (i.e. making items more / less expensive) is generally hurting businesses. We'll explore how price point changes are impacting your business.
Cost?
  • First-Time Participants = $1,800.
  • Existing Participants = $1,000.
Contact me right now (kevinh@minethatdata.com) to join the program and for file requirements.

Key Dates:
  • Payment is due by October 10, 2017.
  • Data is due by October 15, 2017.
  • Analysis will be received by October 31, 2017.

September 20, 2017

What You'll Be Told

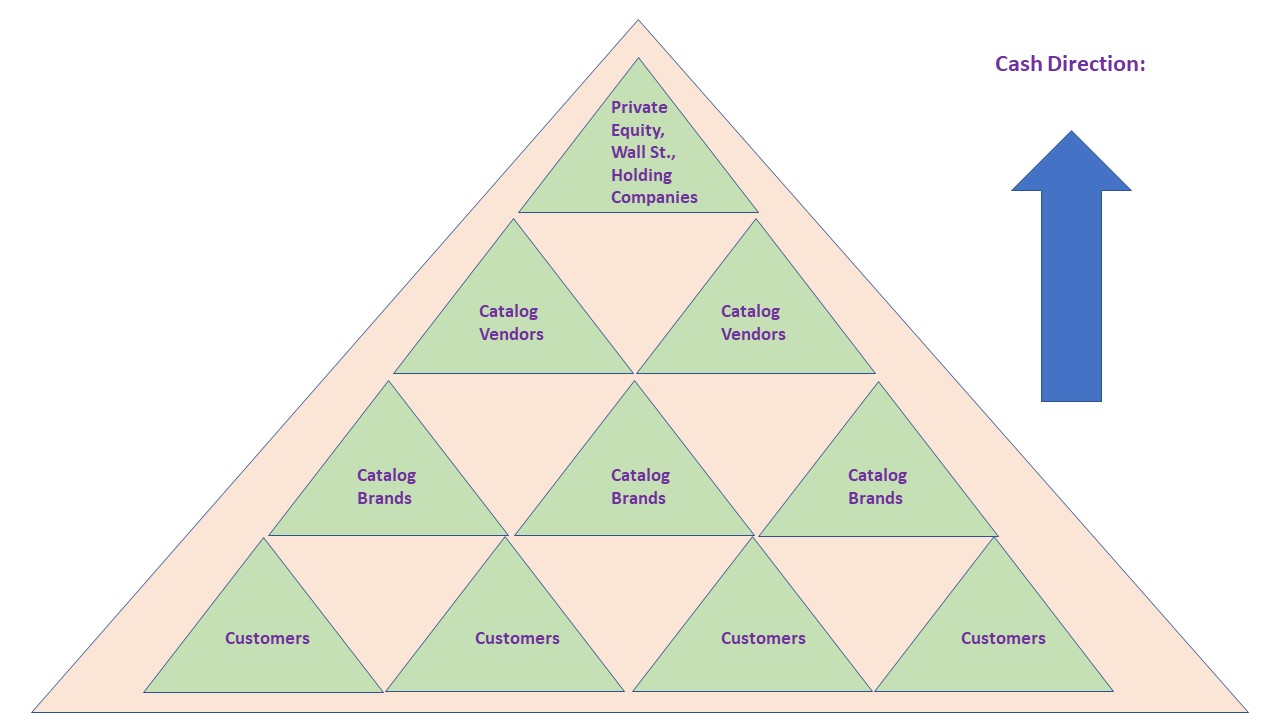
Here's the ecosystem ... $100 is harvested from customers, $25 - $35 goes to vendors, and increasingly independent catalogers are becoming part of holding companies or private equity or Wall St. owned brands.


We're at a point where online brands have 5% - 20% ad-to-sales ratios ... while catalog brands have 20% - 40% ad-to-sales ratios. This difference ... about 20% of $100 generated by a customer, or $20, is flowing to the print industry instead of being repurposed for modernization.

If you go to your partners in the vendor community, vendors who benefit from the 20% tax you pay to put paper in the mail, you'll hear a common story:
  • "If you reduce pages or reduce contacts, you will reduce sales."
You'll be told there are rules of thumb, and those rules of thumb suggest that reducing pages or reducing contacts is a bad idea. And in many ways, the advice is accurate.
  • Sales will decrease when you get rid of pages or contacts.
  • Profit, however, is fungible.
The first thing you'll do is refer to your mail/holdout tests, and you'll quantify the fraction of sales that still happen if catalogs are not mailed. You run the tests, right? And on average, you don't believe the results of the tests, because the test results are inconsistent (because sample sizes are too small because your Executive Team didn't want to "lose sales"). Or, the results are consistent and tell you that half or more of the demand you generate has nothing to do with catalog marketing, and you don't like what the results tell you. Or the most common answer ... you don't execute the tests, because your vendor partners tell you that your matchbacks are fine (they're not - they horribly overstate results in a way that causes you to spend more money on paper/printing).

But if you are honest, you've run the tests, you've validated the findings and then you have partnered with your Finance Team to run a profit and loss statement ... with and without catalogs. Your results might look something like this (your mileage will vary).


You'll show your results to your vendor partners. Here's what you will be told.
  • You lose $50,000,000 if you stop mailing catalogs. You can't do that.
  • You make more profit by mailing catalogs. You can't stop mailing catalogs, or you will be less profitable.
And based on the facts of the table, your vendor partners are right. Your business will be cut in half. You will have to get rid of staff tied to strictly catalog marketing and that will be painful.

But notice that the difference in profit isn't that big.

What would you do if you had an additional twenty million dollars of cash laying around?

You wouldn't just do nothing, would you?

No, you'd do something!

You might execute free shipping 24/7/365 ... you might initiate a loyalty program and you might give your best customers perks previously unheard of, because you'd be able to because you'd have access to all this cash that you used to pay to paper/printer folks.

And you might not get rid of catalogs!

You might do the following ... 
  1. Reduce catalog marketing expense by 70%.
  2. Increase online marketing expense by 50%.
  3. Offer free shipping 24/7/365.
And if you did that, your profit and loss statement might look different.


You're mailing 30% of the catalogs you used to mail - you are doing more online marketing and low-cost / no-cost customer acquisition - and you are doing free shipping 24/7/365. And when you operate your business this way, coupled with the 50% of your business that is organic and not driven by catalog marketing, you quickly learn that you can be just as profitable. Smaller, but just as profitable.

Here's what you will be told.
  1. Sales decreased.
  2. Profit didn't change.
  3. You lost market share.
Now, I went through this back-in-the-day at Nordstrom. We ran the scenarios. We learned that the catalog business was essentially break-even, based on the scenarios we ran, based on how we'd reinvest our efforts.

Then we fully killed the catalog altogether ... and a funny thing happened.
  1. Sales didn't decrease ... online and store sales increased, in fact online sales increased faster than call center sales decreased, resulting in a net direct channel sales increase.
  2. Profit increased dramatically ... without $36,000,000 of paper out there, profit surged.
I worked with a company that tested all of their direct mail and catalog efforts ... and learned that 90% of their sales would happen anyway. The Executive Team did not believe the results, and more importantly, did not know what they would do if the results were true and they ran with the results.

I've also worked with companies that lose 80% of their sales if the catalog disappears. Cutting frequency or pages is catastrophic, and is a bad idea.

So the issue isn't whether you cut 0% of your pages, or 70% of your pages, or 100% of your pages.

The issue is this.
  • Are you willing to think independently - thinking outside of an ecosystem that takes 20% - 40% of your cash leaving you with 5%?
  • Are you willing to run scenarios, to test, to try different tactics and strategies? Are you willing to go where the scenarios take you?
  • Are you willing to speak up? Are you willing to speak with conviction? Are you willing to have an unpopular conversation with a vendor, even if the vendor rep yells at you? Are you willing to have an unpopular conversation with your CEO, even if your CEO yells at you?
I think you are willing to do all of those things!

And I think your vendor partners are willing to go on the ride with you, because I think your vendor partners are independent thinkers. They like strategy. They like confidence. They like being part of a solution. They like success!

The Structure of the Modern Catalog Industry inhibits creativity, and for good reason ... the ecosystem we belong to requires us to pass 20% of our cash along to the vendor community to pay the debt on the fancy printing devices we don't fully take advantage of. Imagine how frustrating it must be to be a printer who goes knee-deep into debt to help you perform better, only to hear that your big change in strategy is moving the November catalog one week later and adding four pages? They're saddled with debt because of our inaction ... we're passing 20% of cash to them to pay the debt. That's a severe tax burden on each side of the equations.

I think our industry ... all sides of our industry ... is better than this.

I'm betting on you. And our vendors. All of 'ya.

Let's do something!

September 19, 2017

More Money Must Come In Than Go Out

Allow me to tell you a brief story.

Last summer (2016), my family drove US-2 across Northern Montana. This is a part of the country that has largely been abandoned by the modern world. That being said, there were two industries that were thriving.
  1. Hospitals and Urgent Care Centers.
  2. Drive-Ins

But overall, it was clear what was happening. As industry left the small towns along US-2, good paying jobs were hard to come by. And without good paying jobs, there wasn't a lot of money to spread around ... and this caused local businesses to close ... and this drove the small towns into even more trouble. 

Now throw Amazon into the mix - they'll deliver anything in a couple of days to Cut Bank ... so money that would have been spent locally instead goes to Amazon, causing Downtown Seattle to thrive.

Who has a plan to revive a small town along US-2 in Northern Montana?
  • The plan would require more money to come into the town than leaves the town.
This brings us to Modern Catalog Marketing ... a situation not fundamentally different than the small towns dotting US-2 in Northern Montana.
  • On average, a cataloger pays $25 - $35 of every $100 spent by a customer to various vendors ... with about two-thirds of that going to paper, printing, and postage.
  • The printing industry (in particular) uses the money to pay their onerous long-term debt load.
So the cataloger gets to keep $5 of every $100 the customer spends ... while the vendor community gets to keep $25 - $35 of every $100 that a catalog customer spends. More money is going out than is coming in (not really, but you get the point ... too much money is going out).

One of the reasons why Nordstrom has been successful over the past 15 years and has been able to hang in there when business is bad is because they spend very little money with marketing vendors. More money comes in than goes out.


How in the heck can you compete with Amazon when you spend an additional $20 of every $100 you take in with print-centric vendors ... while Amazon and other online marketers do not have to do that?

In other words, what could you do if you had an additional $20 of every $100 spent by customers available to you?

This is why I continually ask you to consider the low-cost / no-cost customer acquisition programs that I share on this blog ... programs that my online clients gladly leverage to grow.

Tomorrow, I will share with you scenarios of what business could look like if spending was different. You'll probably disagree with me ... that's fine ... send me an email message (kevinh@minethatdata.com) and I will print your rebuttal provided it is logical and fact-based. You can 100% disagree with me, and that's fine, the industry needs to hear your opinion.

September 18, 2017

The Structure of the Modern Catalog Industry

Remember yesterday's graph?

Well-run catalog companies possess ad-to-sales ratios around 10%. Common ratios are between 25%-35%. It's not uncommon to see a 40% ad-to-sales ratio. When the ratio climbs above 25%, the catalog brand is "owned" by the vendor community.

Here's a poorly conceived flow-chart of who has power in the catalog industry.


In the ecosystem, cash flows from bottom to top.
  • A customer pays a catalog brand $100.
  • The catalog brand keeps $5 cash (pre-tax profit) - and sends $33 cash up the food chain to vendors. More cash goes to vendors than is kept by the catalog brand.
  • Companies that own catalogers and/or catalog vendors harvest profit from catalog brands and/or catalog vendors.
When viewed this way, the catalog brand is nothing more than an intermediary - a tool used by catalog vendors and owners to harvest profit from customers without ever having to do the dirty work of having to deal with actual customers.

Catalog vendor partners are desperate to keep catalogers spending money ... think I'm wrong? Go look at the annual reports for Quad and RR Donnelley and the USPS.
If I combine Quad and RRD ... I see more than eleven billion in annual sales and combined I see losses in four out of five years. And the USPS has run a fifty-nine billion dollar deficit over the past forty-six years. 

Paper, printers and the USPS usually comprise about 65% - 75% of catalog marketing vendor expense. Quad/RRD/USPS data above show you that your vendor partners are teetering, aren't they?

So your paper-centric partners need you to keep executing what you've always executed. Mailing fewer pages or fewer contacts reduces their sales, and with the debt they're carrying, they're toast.


So that's how paper folks / printers / USPS have to manage the situation. They need you to spend more on paper and printing ... their livelihood depends upon it.

Now remember my pyramid above ... who owns Quad, and who owns their debt?
  • Wall Street.
  • Banks.
Who owns RRD, and who owns their debt?
  • Wall Street.
  • Banks
Who owns the USPS?
  • Government.
Those folks are at the top of the pyramid. Wall Street, Banking, Private Equity, Government.

Assorted vendors take a third of your operating cash on an annual basis and use it to generate enough cash to approximately break-even while paying down long-term debt.

Without you, the ecosystem goes bankrupt.

The relationships go outside of your print-centric vendors.
  • Garnet Hill might pay Wiland money for co-op names.
  • This allows Printer / Paper / USPS to get paid, which pays down their debt and can generate profit which gets Wall Street and Private Equity paid.
  • Wiland's parent company is Brentwood Associates (Private Equity), who owns Soft Surroundings.
  • Therefore, Garnet Hill is paying to fund future investment at Soft Surroundings, a competitor. Cash flows out of Garnet Hill and into the ecosystem benefiting Soft Surroundings. In the future, your catalog brand will have to be part of an ecosystem where dollars flow in. In this example, dollars flow out.
  • Future investments at Soft Surroundings allow the USPS, Paper Folks, and Printers to get paid (again), flowing money up the pyramid.
  • Any profit earned by Garnet Hill is captured by their parent company (Cornerstone Brands).
  • Cornerstone Brands then funnels profit into Home Shopping Network (Cornerstone's parent company).
  • HSN then funnels profit into QVC (HSN's parent company). Who owns QVC? Wall Street!
  • Meanwhile, Soft Surroundings might take their cash and invest it with Abacus to purchase co-op names.
  • Abacus earns profit from this transaction.
  • To mail the catalogs, the USPS, Paper Folks and Printers all get paid (again - notice how these folks always get paid on a variable cost basis?).
  • Abacus is owned by Epsilon. Data and Profit pass from Abacus to Epsilon.
  • Epsilon uses the data to partner with Facebook - meaning that Soft Surroundings is indirectly paying Facebook to better target Soft Surroundings customers all across the internet for products likely to compete against Soft Surroundings.
  • Who owns Facebook? Wall Street.
  • Epsilon is owned by Alliance Data, a publicly traded company generating $6.4 billion in sales and 20% profit (yup, that's a lot). You are ultimately an intermediary who pays Abacus to pass data up the pyramid so Alliance Data can do a better job of targeting outside of the catalog industry and generate revenue. Think about that for a moment
  • Who owns Alliance Data? Wall Street! 
  • Soft Surroundings finds that their investment ends up benefiting Alliance Data and companies like Facebook. Any profit earned by Soft Surroundings filters up to Brentwood Associates. Who is Brentwood Associates? Private Equity!!
  • Did you notice that Wiland presented at NEMOA - paired with a sister brand via their Private Equity parent? Undoubtedly they paid a sponsorship fee to get an opportunity to get you to spend money (with Wiland), money flows up to Private Equity and can then be reinvested across catalog brands they own (or wish to own).
  • Your money goes out and is repurposed within the ecosystem. In the future, you will have no choice but to belong to an ecosystem where more money comes in than goes out. If more money goes out than comes in, then you have to increase merchandise productivity to overcome what is going out - and that is HARD work!
Here again is the pyramid.


Now, what do you think the response will be if I come along and demonstrate that low-cost / no-cost customer acquisition programs are something you should pursue?
  • Do the tactics use paper? No? Then the tactics don't fit within the ecosystem.
Our industry has been sold a message ... for more than twenty years now ... a message that leaves the catalog brand as nothing more than an intermediary ... passing money up the pyramid.
  • Most interesting (to me) is that as the ecosystem took control over the catalog industry, catalog professionals left the industry to work online. Many left in the catalog industry have only known this ecosystem, and enjoy obtaining guidance from those in the top half of the pyramid. This makes change very difficult - and the ecosystem requires this, because without cash from catalog intermediaries, vendors go out of business.
That's a lot to think about, isn't it?

To me, this explains why it is so darn hard to get a catalog brand to do anything innovative ... the ecosystem that passes money up the pyramid dissuades it from happening.

It's likely that you disagree with me. How about sending me an email message (kevinh@minethatdata.com), sharing your thoughts? If your thoughts are logically composed, I'll be happy to publish them on this blog - even if your thoughts defend the pyramid structure outlined here.

September 17, 2017

They Think It Is A Bad Idea

Here's something I hear often.

  • "We floated the idea of an improved contact strategy by our vendor partners. They weren't excited about it".
Duh!

Of course your vendor partners think it's a bad idea to improve your contact strategy. Your contact strategy is the reason they are in business!

Have you ever spent a few minutes thinking about who gets paid by the operations of your business? Here's an example:


Product vendors deserve to be paid, of course, or YOU aren't in business!! So they earn (in our example) $45 of every $100 you sell.

Marketing vendors need to EARN the right to be paid. When I worked at Nordstrom, we spent less than 2% of net sales on marketing. Let that sink in for a moment. Meanwhile, it is common for catalogers to spend more than 30% of sales on marketing ... in our case here, the fraction is 33%. And if you break the numbers down, you learn something interesting.
  • $8 of every $100 sold are paid to your Paper Rep (your rates will vary).
  • $8 of every $100 sold are paid to your Printer (your rates will vary).
  • $8 of every $100 sold are paid to the USPS for Postage (your rates will vary).
  • $6 of every $100 sold are paid to online marketers (Google + Facebook + Retargeters + Affiliates + Assorted Middlemen & Middlewomen).
  • $2 of every $100 sold are paid to catalog co-ops and assorted catalog vendors.
  • $1 or less of every $100 sold are paid to your email vendor.
In our example, the cataloger earns a typical 5% pre-tax profit rate off of the operations of the business.

Your paper rep makes more off of the operation of your business than you make.

Your printer makes more off of the operation of your business than you make.

The USPS makes more off of the operation of your business than you make.

A myriad of assorted online marketers make more off of the operation of your business than you make.

This is why your vendor partners dissuade catalogers from moving into the future.
  • Significantly more money is made off of the operation of a catalog brand by vendors than by the catalog brand.
When you read stuff like this (click here) and then you look at the breakdown of payments above, you begin to understand why your vendor partners think it is a bad idea to make catalog contact strategy changes that move you closer to the future.

Tomorrow, I'll share some thoughts about what the catalog industry has become.

September 14, 2017

The Next Run Of The MineThatData Elite Program!!

Every four months, we celebrate a new run of The MineThatData Elite Program! It's time to do that again.

The #subscription based program continues to evolve. With this run, I am going to shift focus just a bit.

Here's what you will get:
  • Your standard comp segment analysis.
  • Your standard comp new + reactivated analysis.
  • A continuation of a handful of rolling twelve month metrics.
  • Your annual repurchase and file composition table.
Here's two new things added for this run:
  • A "grid" that illustrates where changes in your customer file generate the most "leverage" ... similar to stuff we've been talking about over the past two weeks.
  • Rolling Price Point Information ... one of the biggest problems I've observed in 2017 projects is that changes in price point strategy (i.e. making items more / less expensive) is generally hurting businesses. We'll explore how price point changes are impacting your business.
Cost?
  • First-Time Participants = $1,800.
  • Existing Participants = $1,000.
Contact me right now (kevinh@minethatdata.com) to join the program and for file requirements.

Key Dates:
  • Payment is due by October 10, 2017.
  • Data is due by October 15, 2017.
  • Analysis will be received by October 31, 2017.


P.S.: Ok, it's time for what is becoming a tradition ... the links at the end of the blog post. Have you read this interpretation of the new iPhone (click here)? There's a quote that all catalogers should read ... so I'll print the quote here ... we begin with the introduction of the iPhone a decade ago.
  • The iPhone represented a fresh start for the company — and Steve Jobs, had learned his lessons well. Don’t depend on a third party to be enabler of your key innovations and capabilities. I have written about the critical need for vertical integration for today’s giants in the past.
    Just imagine Apple having to depend on Qualcomm to supply its chips — it will be tied into Qualcomm’s ability to come up with new technology — and thus will be working on a timeline defined by the San Diego chip giant. Mind you, this doesn’t factor the harsh reality of paying Qualcomm premiums and having to worry about losing chip supplies to someone with bigger orders and desire to work on razor thin margins.
This brings us to the catalog industry. Let's replace the second paragraph, removing "Apple" and plugging in "Catalogers" ... then removing "Qualcomm" and plugging in "Co-Ops" ... and removing "chips" and replacing it with "customers" ... now we have the following:
  • "Just imagine Catalogers having to depend on Co-Ops to supply its customers - it will be tied into the Co-Ops ability to come up with new technology - and thus will be working on a timeline defined by the Co-Ops. Mind you, this doesn't factor the harsh reality of paying the Co-Ops premiums ..."
Sobering, quite honestly.

The MineThatData Forecasting Challenge!!

Ok, time for some fun, if you are an analytics guru!

I have a dataset for you ... it contains annual sales on a rolling twelve month basis for the past 83 months (month = 00 through month = 79). You can click here to download the Excel Spreadsheet.

Here are the variables in the dataset.
  • Month = 00 to Month = 79.
  • Annual Sales:  Total.
  • Annual Sales:  Call Center.
  • Annual Sales:  Website.
  • Annual Sales:  Email Marketing.
  • Annual Sales:  Search (Paid and Natural).
  • Annual Sales:  From Items New In The Past Year.
  • Annual Sales:  From Existing Items.
  • Annual Sales:  From The Primary Merchandise Category This Company Sells.
  • Annual Sales:  From All Other Merchandise Categories.
  • Annual Sales:  From Items $0.01 - $9.99.
  • Annual Sales:  From Items $10.00 - $19.99.
  • Annual Sales:  From Items $20.00 - $29.99.
  • Annual Sales:  From Items $30.00 - $49.99.
  • Annual Sales:  From Items $50.00 - $99.99.
  • Annual Sales:  From Items $100.00 - $249.99.
  • Annual Sales:  From Items $250.00+.
A few key tidbits:
  • Total = Call Center + Website + Email Marketing + Search.
  • Total = New Items + Existing Items.
  • Total = Primary Merchandise Category + All Other Merchandise Categories.
  • Total = Items $0.01 - $9.99 + Items $10.00 - $19.99 + Items $20.00 - $29.99 + Items $30.00 - $49.99 + Items $50.00 - $99.99 + Items $100.00 - $249.99 + Items $250.00+.
Here's the Forecasting Challenge:
  • Given the data in the dataset, predict Annual Sales in Month = 80, Month = 81, and Month = 82.
Forecasting Challenge Extra Credit:
  • Given the data in the dataset, predict Annual Sales for each variable in the dataset for Month = 80.
  • Then, use the data in the dataset and the prediction for Month = 80 to predict Annual Sales for each variable in the dataset for Month = 81.
  • Then, use the data in the dataset and the predictions for Month = 80 and Month = 81 to predict Annual Sales for each variable in the dataset for Month = 82.
The person / team / company that minimizes squared error for Annual Sales - Total in the Forecasting Challenge will be deemed the winner. Yes, I have the actual values for months 80/81/82.

The person / team / company that minimizes squared error for Annual Sales - Total in the Forecasting Challenge Extra Credit will also be deemed a winner. Yes, I have the actual values for all variables for months 80/81/82.

The person / team / company that wins either challenge will have their results published on this Blog (2,500 subscribers), on Twitter (6,600 followers), and on my Podcast (71,000 downloads). So yes, your answer will receive some exposure!  I will also send a free copy of Hillstrom's Fix It to the winning person / team / company.

Your solution must be written up in white paper format - fully explaining the methodology you use, and fully sharing the equations or math used to make the prediction. If you don't provide a white paper publicly outlining/sharing your methodology/results/predictions, you will not be eligible to win.

Cost to Enter = Free!

Cost to Submit a Potentially Winning Solution = Free!

Due Date:  Your solution is due no later than 11:59pm PDT on October 31. Late submissions will not be accepted.

Ok, who is ready to accept The MineThatData Forecasting Challenge??!!

September 13, 2017

MineThatData Academy!!

I've worked with many of you to get the bugs out of the simulation algorithm. There's been many different versions, and many different tests. And now, finally, the bugs have been worked out and we have a simulation that gives participants a fighting chance to test their chops ... and most important ... a fighting chance to come from behind if year one doesn't go very well.

The simulation is called "MineThatData Academy":


This is a ten-team example ... the simulation is designed to handle up to twenty individuals/teams.

You get to determine your strategy across many dimensions.
  • Online Advertising.
  • Offline Advertising.
  • % off Strategy.
  • Shipping Revenue (or Free) Strategy.
  • Price of Widgets.
  • Price of Bidgets.
  • Price of Tidgets.
  • % of Your Merchandise Assortment = New.
  • Mix of Brand Marketing Strategy and Technology/Personalization.
You will be provided with limited metrics ... not enough data to "perceive" you can do a good job ... but you'll be able to do a good job because you are smart.

Alright, here's what you get.
  • Option #1 = On-Site Visit. 9-12 = Simulation. 12-1 = Lunch. 1-5 = Business Discussion With Your Team, Can Go In Any Direction You Want.
  • Option #2 = Virtual Academy. 1-4 = Simulation, 4-5 = Business Discussion With Your Team.
Contact me for additional details (kevinh@minethatdata.com).

These "Academy" sessions work really well at Vendors as well as E-Commerce / Retail / Catalog Clients ... and the structure is perfect for conferences.

Soooooo ... who's ready to set the HIGH SCORE at the MineThatData Academy? Who has the business chops to succeed? Email me and let's have some fun! (kevinh@minethatdata.com).


P.S.: Here's a medium-cost customer acquisition strategy discussion in fashion, should you be interested. Read what Ralph Lauren did with 300 "influencers" ... what would stop you from doing something comparable with your best customers?

P.P.S.:  Read the link in Issue #61 in this missive from MailChimp (Click Here). Do you travel the world to find stories worthy of sharing? That's a form of low-cost customer acquisition - certainly cheaper than paying Facebook a million dollars, #amirite?

P.P.P.S.:  Since this industry loves paper, here's Shopcodes from Shopify (Click Here).

P.P.P.P.S.:  Two days ago, this link got 319 clicks ... that's as many as any link I've put up here (Click Here). Put Facebook and Catalogs in the same sentence and you swarm the link like wasps attacking a rotting orange!


Items That Appear In Multi-Item Orders

In a typical Life Stage Analysis within a Merchandise Dynamics project, it is common to see exaggerated trends when comparing first-time buy...