May 31, 2023

Picklemall

Many of you have forwarded articles to me outlining how your local mall is considering taking empty space and turning it into pickleball courts.

Here is one of the concepts, with a key investor being Steve Kuhn from Major League Pickleball. This concept is coming to Arizona Mills in Tempe (click here).

Name one omnichannel expert prescient enough to forecast that adhering to the omnichannel thesis would result in closure of stores, with the square footage being replaced by (checks notes) pickleball?

I mean, in the image, it looks like an entire dead anchor store is being replaced by pickleball.

By the way, if you've never watched pickleball online, watch the Major League Pickleball matchup headed to Southern Cali in two weeks. Crazy good play and energy (#jessieirvine).

May 30, 2023

Oh Look, Email Marketing Works

Here's a scenario I ran through our Marketing Budget Experiment framework. I simply ended email marketing for the next five years ... none of it whatsoever. What happened?


Oh my goodness.

The impact is multiplicative over time.

Top-Line Demand drops from $229 million to $191 million to $173 million to $149 million to $141 million ... the brand loses $272 million over five years. Woo-boy!

The profit hit is nasty ... dropping $11 million in year one, then $12 million, $14 million, $15 million, and $16 million.

Almost all of the buyers impacted are existing buyers ... down 218,000 five years from now (vs. just 8,000 newbies per year). Take away a key purchasing channel and these customers buy less often ... and they buy less often across all channels because of the dramatic loss of file power.

Rebuy rates? They fall from 49.7% to 37.0% five years from now. There are fewer buyers, and it's a weaker file of buyers.

Next time somebody grumbles about what you're doing with email marketing, put this scenario in front of them ... run it for your brand. Show the critic that s/he doesn't have the slightest idea what s/he is talking about.

And if you don't have the scenario readily available, contact me right now (kevinh@minethatdata.com ... https://blog.minethatdata.com/p/hire-kevin.html) and we'll get busy, ok?

May 29, 2023

Automation

This tweet (click here) reminded me of a call I received in 2016

The call was from a Chief Marketing Officer. He discussed his vision for marketing.

  • "I envision being the only marketing employee. I'll sit behind a dashboard, clicking requests to computer systems and vendors who carry out my wishes. No employees. Just me. I can sell anything, and I don't need anybody to sell it."
This day is coming ... not in 2023, but it is coming. Digital marketing can be commoditized. Has been happening for 25 years.

May 25, 2023

Summer Schedule

As usual, my summer schedule will dial back just a bit ... maybe three posts per week instead of five, sometimes four, sometimes more.

And yes, we'll be focusing on Marketing Budget Experiments ... by the time we get to Fall, you'll need to run 'em to understand how to plan for 2024.

May 24, 2023

It's Time!

Four months goes by in the blink of an eye.

It's time for the next run of the MineThatData Elite Program. For just $1,000 ($1,800 for new clients) you get my standard suite of metrics plus analysis.

Our October run was the most popular run in program history (eight years), and from what many of you are telling me this run is going to be popular as well, given the difficulty of overcoming price increases over the past two years.

Contact me now (kevinh@minethatdata.com) and we'll get started.

May 23, 2023

Customers > $$$

Yesterday I showed you how profit increased with a 2.5% increase in rebuy and a 2.5% increase in spend.

  • Year 1 = $3.8 million.
  • Year 2 = $4.4 million.
  • Year 3 = $4.8 million.
  • Year 4 = $5.2 million.
  • Year 5 = $5.6 million.
For the same company, instead of a 2.5% / 2.5% increase, let's go with a 5.0% / 0.0% increase. Rebuy gains also apply to new customer gains.


What kind of profit gains do we see here?
  • Year 1 = $3.8 million.
  • Year 2 = $4.7 million.
  • Year 3 = $5.7 million.
  • Year 4 = $6.6 million.
  • Year 5 = $7.5 million.
Over the following four years this brand makes an additional $4.5 million by increasing rebuy rates more than increasing spend per repurchaser.

Always prioritize customers over spend per repurchaser. Both are important - yes - both are important. But you always want more customers.


May 22, 2023

What Does A Sustained Gain Look Like?

In this Marketing Budget Experiment, we compare what happens when business is "as is" vs. a 2.5% bump in merchandise productivity via rebuy rates / new customers ... and a 2.5% bump in merchandise productivity via increased spend per customer.


You'll likely need to click on the image to see it properly.

The jump in rebuy rate and spend impacts profit increasingly over time.

  • $3.8 million in year one.
  • $4.4 million in year two.
  • $4.8 million in year three.
  • $5.2 million in year four.
  • $5.6 million in year five.
Mind you - I didn't compound productivity gains ... they are 2.5% in response and spend for year one, then they are the same 2.5% each year thereafter ... no subsequent gains. But the impact is not unlike compound interest. You have more customers, those customers spend more.

Tomorrow we'll see how the business responds to a 5% increase in rebuy/newbies and a 0% increase in spend.


May 21, 2023

We Need Their Help

A quarter century ago at Eddie Bauer, we had what we called "QPM"s ... "Quarterly Planning Meetings". Everybody accountable for the catalog/online business at Eddie Bauer, in a room, presenting their plans.

Somehow the merchandising team were able to get off the hook in these meetings.

They'd talk about how the assortment was "trend right" while everybody nodded their heads affirmatively.

Then I'd have to present the marketing plan and woo-boo that didn't go well. First of all, it wasn't a marketing plan ... the true marketing team would sit along the wall not having to present anything ... my plan was essentially a Marketing Budget Experiment, and a poorly constructed one at that. It was the result of my team performing a month of bottoms-up segment plans with assumptions. Any criticism of any assumption and it meant another week of bottoms-up recalibrations.

Eddie Bauer LOVED these recalibrations. It was busy-work masquerading as strategy. Entire teams managing hefty spreadsheets, working together to come up with "a plan" only to have somebody say something strategic like "shouldn't marketing productivity be +3% instead of +2% ... isn't it time marketing stepped up to the table?"

And then we'd spend a week crafting another scenario.

After enduring six months of these things (i.e. two meetings and the run-up to these meetings) I created my own high-level assumption worksheet. This allowed me to run a series of scenarios behind the scenes, quickly, without having to worry about putting 16 people through a week of spreadsheet manipulations at a segment level.

I'd be able to see how much help I needed from our merchandising team. 

A simple 2.5% gain in productivity via rebuy rates and spend per repurchaser yielded compound interest over time. More customers purchased, compounding the number of purchasers in the future. Customers spent more, delivering short-term profit. All of it added up to "more" on a compounding basis.

This allowed me to shift focus in a QPM ... from somebody picking nits to placing the attention where it needs to be placed. Where does it need to be placed? Merchandise Productivity.

We need the help of our merchandising partners. I realize they're trying hard, but when business is not meeting expectations, the last thing we need is an Executive deflecting attention away from what we sell to how we sell it.

When your merchant partners are not helping ... you need to pick up a broom. Every company ... even failing companies ... have products that sell really well. Marketers are accountable for selecting the products that sell well ... and marketers are accountable for promoting new products today so that there are winning products tomorrow. Show the customer the stuff other customers like. This increases productivity as well.

Does that make sense?

May 18, 2023

Let's Just Spend More Across All Marketing Channels In June!

Ok, your social media manager took his/her lumps by recommending doubling spend in June.

That being said, there are cases where the Chief Marketing Officer takes lumps as well.

In this case, the CMO arbitrarily decides to spend 20% more across all channels in June. "We're capturing market share!" he gleefully proclaims. Meanwhile, somebody is running a Marketing Budget Experiment and knows what it costs to capture market share.


Click on the image for details ... they are interesting. Or read here for a summary.
  • Year 1 Profit = ($326,000).
  • Year 2 Profit = $81,000.
  • Year 3 Profit = $79,000.
  • Year 4 Profit = $70,000.
  • Year 5 Profit = $64,000.
  • Total Profit = ($33,000).

In other words, for this brand, capturing market share in June is a bad idea. This brand doesn't make up the investment over five years ... losing $326,000 and then coming up short in the years that follow.

It's important to have a tool like this, so that you can run scenarios and then test your way into the stuff that looks like it "could" work.


May 17, 2023

The Tradeoff

Our intrepid Social Media Manager wanted to blow out the June budget. That didn't look like a good idea.

Cutting back on the budget? That only works for awhile, and then you harm long-term profit too much.

There are balancing points ... points where the tradeoffs between short-term profit and long-term profit are reasonably balanced. There is no right answer here ... just choices and consequences. But you at least want to understand the consequences of your choices, right?

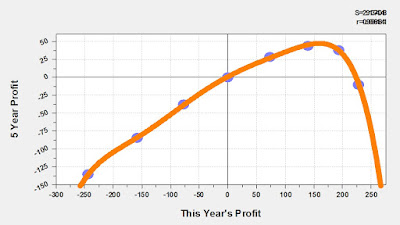
In our example, the graph below depicts the relationship between short-term profit optimization (x-axis) and long-term profit optimization (y-axis) for June investments in Paid Social.


If you lose a ton of money this year, you never make up enough long-term to be in an acceptable situation.

If you make too much money this year, you never are in a situation where you make enough long-term profit to be in an acceptable situation.

The graph above shows us, based on this Marketing Budget Experiment, that there is a range of options that kind of optimize both short-term and long-term profit ... not an answer that anybody will be happy with, but that's how this stuff works.

In this case, you are better off to add about $150,000 in profit this year but then forego future profit so that in total you are about $50,000 better off over time (which means that you give up $100,000 in future profit).

In this case, the best of a bunch of sub-optimal choices happens by cutting the Paid Social budget by 40% in June ... with comparable answers happening by cutting the budget by 20% or 40% or 60%.

Somebody at this company is not going to like that decision. They won't like that you make less profit in the future.

Somebody at this company is not going to like today's outcome - they won't like the fact that this company is less profitable today because of the current strategy and wants today to look better.

That's why we run Marketing Budget Experiments ... we get to assess different outcomes and not have theoretical arguments based on one (1) implemented strategy.

In this situation, which investment decision would you make, and why would you make it?


May 16, 2023

Should I Cut Back In June?

Yesterday we talked about the poor Social Media Marketing Manager who wanted to double the June Paid Social budget. Our Marketing Budget Experiment illustrated that this was a bad idea.

This is one of those moments where I might feel spiteful, wanting to cut the budget. If increasing spend was that unprofitable, maybe decreasing spend is a good idea?

Here was our base case.


And here is the outcome of the Experiment after cutting the June Paid Social budget in half.


The results are kind of interesting.

  • Demand drops by $380,000 this year.
  • Demand drops by $184,000 next year.
  • Demand drops by $173,000 two years from now.
  • Demand drops by $152,000 three years from now.
  • Demand drops by $136,000 four years from now.
  • You lose $1,024,000 of demand over five years.

In other words, the decision you make today costs you business every year going forward (in the case of this brand).

How about profitability?
  • Profit improves by $169,000 this year.
  • Profit is hurt by $32,000 next year.
  • Profit is hurt by $34,000 two years from now.
  • Profit is hurt by $30,000 three years from now.
  • Profit is hurt by $28,000 four years from now.
  • You increase profit by $45,000 over five years.

Now you're left with a dilly of a pickle, aren't you? Technically, it makes sense over the next five years to cut back on Paid Social in June, but not by much. If your goal is to be more profitable this year, absolutely, cut the budget. But you pay for your decision next year because you'll give up profit next year and each year thereafter.

We're making these short-term / long-term tradeoffs every single day, and we have no visibility into the long-term aspect of those tradeoffs. That's a problem, isn't it?

We'll evaluate a different tradeoff tomorrow ... maybe we can optimize our way into a better marketing strategy???


May 15, 2023

The Manager Says "Give Me Some Money"

Maybe your Social Media Marketing Manager wants to go "all out" in Paid Social in June. S/He thinks there is a huge opportunity - some newsletter says that customers will be receptive and they publish a bunch of charts and graphs illustrating "the opportunity". S/He says "Give Me Some Money!"

You have access to a Marketing Budget Experiment worksheet, so you enter the Budget Tab and you double your June investment in Social.


You click over to the P&L tab to obtain your outcome.


Then you compare this outcome to your Base Case, where business is forecast "as is".


Your Social Media Manager is excited.

You, on the other hand, are not thrilled.

Demand improves not only this year, but in the future as well.

  • $519,000 this year.
  • $251,000 next year (because the customers you inspire to purchase begin paying you back downstream).
  • $236,000 two years from now.
  • $207,000 three years from now.
  • $185,000 four years from now.

Your Social Media Manager says "SEE!!!".

You direct your Social Media Manager to the Variable Operating Profit line.
  • ($419,000) this year (uh oh).
  • $44,000 next year.
  • $46,000 two years from now.
  • $41,000 three years from now.
  • $38,000 four years from now.
  • A five year net loss of $250,000.

You tell your Social Media Manager "No".

As your Social Media Manager leaves your office (virtually or in person), you decide to see what might happen if you cut his/her budget by 50% in June (instead of doubling it). We'll look at that outcome tomorrow.


P.S.:  Intrigued? Contact me now (kevinh@minethatdata.com) for your Marketing Budget Experiment project ... click here for pricing details.

May 14, 2023

The P&L

This is where we're headed:


Let's say you want to invest an additional $100,000 in paid search. You should be able to see a p&l, presented to you immediately, showing you how the business evolves over the next five years.

Right?

Yeah, you deserve that. You shouldn't be guessing.

And yes, I realize what is depicted above is a guess ... but it is better than a random guess without the information above.

You deserve a Marketing Budget Experiment.

May 11, 2023

Graphical Depiction of the Relationship

Ok, we all know that as we spend more we get more customers, but at an ever-diminishing rate of return.


The diminishing rate of return is what prevents us from spending into infinity.

The diminishing rate of returns impacts ROAS - causing it to get progressively worse as we increase spend.


Turns out there is a comparable relationship between ROAS and CAC.


Lousy ROAS figures (< $2.50 in our example) translate to exponentially higher CACs as the law of diminishing returns wreaks havoc.

Interestingly, CAC and Profit per Order (PPO) have a linear relationship, meaning that CACs can be directly converted to PPOs if you know what the Profit Factor is.


In this example (your mileage will vary), a break-even Profit per Order (PPO) corresponds with a CAC of $40.00.

The fun part of all of this is depicting the number of customers you generate via marketing and how much short-term + long-term future profit you generate. This relationship is illustrated below, and it is a beautiful relationship!


Absolutely delicious!  We add PPO and CLV together, then multiply it by the number of customers generated to yield optimal profitability (short-term + long-term). This happens around 1,450 customers.

Of course, we want to translate 1,450 customers back to ad spend, informing us what the optimal amount of ad spend is. Here we go!


This is what Hillstrom's Marketing Budget Experiments are all about. The optimal amount of marketing spend here is somewhere around $40,000 to $60,000. 

If we spend $50,000 on this campaign, here's what campaign results look like:

  • Sales = $146,409.
  • Ad Cost = $50,000.
  • ROAS = $2.93.
  • AOV = $100.
  • CAC = $34.15.
  • PPO = $5.85.
  • CLV = $35.00.
  • PPO + CLV = $40.85.
  • Campaign Profit = $8,563.
  • Future Profit + Campaign Profit = $59,806.
You probably don't like the ROAS you see there.

Where is campaign profitability optimized?


Oh oh.

Campaign Profit is optimized at an ad spend of $20,000. (PPO + CLV) * Customers Profitability is optimized at an ad spend of $50,000. Here are your metrics if you spend just $20,000 on the campaign.

  • Sales = $96,938.
  • Ad Cost = $20,000.
  • ROAS = $4.85.
  • AOV = $100.
  • CAC = $20.63.
  • PPO = $19.37.
  • CLV = $35.00.
  • PPO + CLV = $54.37.
  • Campaign Profit = $18,775.
  • Future Profit + Campaign Profit = $52,703.

Yeah, the two scenarios are quite different, aren't they?

There isn't a right or wrong answer here. There are simply choices and consequences.

  • Spend less, be more profitable today, be less profitable tomorrow.
  • Spend more, be less profitable today, be more profitable tomorrow.
You can't do both.

This is what Hillstrom's Marketing Budget Experiments are all about (click here for pricing).

May 10, 2023

How Do These Metrics Fit Together?

Two metrics ... ROAS and CAC ... are quite popular in digital marketing, and for good reason ... each metric is easy to calculate. Furthermore, each metric essentially measures the same thing.

ROAS = Return on Ad Spend. If you generate $1,000 in sales and you spend $500 to generate the sales, ROAS = $1,000 / $500 = 2.00.

Now let's assume that the AOV is $100. This means you generated $1,000 / $100 = 10 customers.

If all of those customers are new (and they generally aren't new), your CAC or "Customer Acquisition Cost" is $500 / 10 = $50.00.

So now you have a lot of metrics, but you don't have a lot of intelligence. That's a bad combination.

We're one metric away from having something useful.

If you know your "Profit Factor" ... the percentage of sales that flow-through to profit prior to fixed costs, we have something useful. This allows us to convert ROAS and CAC to a more meaningful metric ... "Profit per Order".

  • Total Demand/Sales = $1,000.
  • Ad Spend = $500.
  • ROAS = $2.00.
  • CAC = $50.00.
  • Profit Factor = 40%.
  • AOV = $100.
  • Customers = 10.
  • PPO (Profit per Order) = ($1,000*0.40 - $500) / 10 = ($20.00).
At this point, you have something meaningful.

You cost your company $20.00 of profit to generate each of 10 orders.

If, after five years, your customers have a CLV of, say $14.00, you made a terrible decision.

If, after five years, your customers have a CLV of $72.00, you made a great decision.

You will not know if you made a terrible decision or a great decision until you convert ROAS / CAC to PPO ... Profit per Order. Once you do that, you compare PPO to CLV and you have actionable information.

In Hillstrom's Marketing Budget Experiments, the secret to the whole puzzle comes down to two key factors.
  • Law of Diminishing Returns in Marketing Spend.
  • Ratio of PPO to CLV.
Not a lot of people know how to quantify the Law of Diminishing Returns.

Not a lot of people measure the tradeoffs between PPO and CLV.

Figure those things out and you are well on your way to helping your company achieve a healthy future!


P.S.:  As we'll see tomorrow, CAC and PPO are essentially the same metric ... with PPO just being more useful.

May 09, 2023

Merchandise Productivity Impact on CLV

It's just so darn important to put what the customer wants to buy in front of the customer.

I mean, it's more important to develop outstanding merchandise and to develop great creative presentation of outstanding merchandise.

But most marketers have no control over that - they might have control over what the customer sees.

Between what the marketer does and what the merchants / creative folks do, productivity will improve, and when it improves, long-term customer value improves.

Think about it this way ... let's assume that you acquire a customer, and over the next five years you generate the following:

  • Future Demand = $60.00.
  • Profit Factor = 40%.
  • Future Ad Cost = $12.00.
  • Future Profit = $60.00*0.40 - $12.00 = $12.00.
Now, between you and your merchants and your creative team (and others, yes), you increase merchandise productivity by 10%. What does future profit look like?
  • Future Demand = $66.00.
  • Profit Factor = 40%.
  • Future Ad Cost = $12.00.
  • Future Profit = $66.00*0.40 - $12.00 = $14.40.
In this example, a 10% increase in merchandise productivity yields a 20% increase in future profit (CLV).

Better yet, it means you can spend more to acquire the customer, which causes you to generate more new customers, which causes future sales to increase as well.

There are good reasons I consistently encourage you to focus on merchandise ... your marketing performance depends upon it!!

May 08, 2023

Who Is Buying? ICLV

In my Marketing Budget Experiments project development, I segment customers in two different ways.
  1. New customers stay in a cohort through the rest of the year. They stay in the cohort in the subsequent calendar year as well.
  2. Existing customers are modeled via regression models, and are split into twenty-five (25) segments of varying levels of customer quality.
Now, each marketing channel appeals to a different audience. Paid Social might appeal primarily to prospects, but not entirely to prospects. If you increase Paid Social spend by 50%, you will mostly generate new customers, but some existing customers will purchase as well.

This is where our Experiments become interesting.

With new customers, we balance the cost of acquisition with CLV ... customer lifetime value. Most clients look to be paid back within about 7-12 months. Most of the work I've performed suggests the payback window should be more than 7-12 months ... your mileage will vary.

With existing customers? Spicy nacho dip. Here you are looking at ICLV ... or "Incremental Customer Lifetime Value". When you take a customer who had Recency = 7 month and Frequency = 4 purchases and you convert the customer to Recency = 1 Month and Frequency = 5 purchases, you change ICLV (incremental customer lifetime value). The customer might have been worth $30 of profit in the next five years and the customer is now worth $45 of profit in the next five years. The difference ... $45 - $30, is ICLV. The marketing effort added $15 of CLV to this existing customer.

It turns out that ICLV plays just as big a role as CLV in determining if the long-term impacts of marketing outweigh the short-term cost of marketing.

May 07, 2023

Last Chance To Get In On The Trial Of Hillstrom's Marketing Budget Experiments!!!

You have until 8:30pm EDT / 5:30pm PDT on Monday (5/8) to communicate interest in participating in my trial of Hillstrom's Marketing Budget Experiments ... earning the right to pay just $12,000 for the project.

Interest has been high - I set a weekly record last week for people clicking on my "Hire Kevin" page. There may be a half-dozen trials based on current interest, likely more after this post is received.

I created a .pdf document outlining the trial ... click here to read the document.

If you cannot commit to the project yet (i.e. you need approval from your Executive Team), then please email me your interest by the deadline above and I will honor trial pricing when you get approval.

After 8:30pm EDT tomorrow, this project will cost $19,900 ... the normal price for this project ... so communicate your interest to me immediately.

May 04, 2023

Your Payback Window

Yesterday, we established the fact that ROAS is related to Profit per Customer/Order. The two metrics are directly related ... Profit per Customer/Order is directly actionable.

What makes this stuff fun is the balance between how much money you lose within campaigns (yes, you notice I said "lose" ... gonna be a controversial take going forward) and how much money you make thereafter. There is a balance, and it takes some sophisticated math to evaluate the balance. Fortunately, I have thousands of lines of computer code to perform the math required to evaluate the relationship.

In the scenario below (and this graph is important), we plot the relationship between how much we spend within marketing campaigns and how much long-term profit we generate. Each curve represents a payback window. If our payback window requires us to execute a profitable campaign, we can spend a small amount of marketing dollars. If our payback window allows us to make the most profit over time, we can spend a lot of marketing dollars. A lot!

Here's the relationship.


The arrows are important here. The arrows tell us how much to spend on marketing to achieve optimal profit. Each curve represents a different payback window.

If you need a lot of profit today, you spend a small amount on marketing.

If you want a lot of profit tomorrow, you spend a lot of money on marketing.

If you are unhappy with the size of your business today, it's the cumulative impact of many years of trying to optimize short-term profit that leaves you with too little profit today.

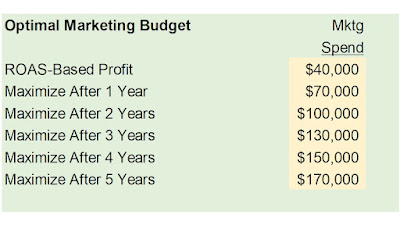
The optimal levels of profit above are illustrated in the table below.


ROAS-centric marketing requires a small amount of marketing spend to optimize campaigns right now. If your ROAS is high, you made sure you delivered profit today.

But if long-term value is sufficient (and in this case long-term value is sufficient - see below)?


If you generate $46 of profit over five years, you might be willing to lose $30 per customer/order within a marketing campaign (which yields an amazingly low ROAS) because the long-term health of your business is assured.

I created an algorithm ... thousands of lines of computer code. The algorithm tells the secrets to marketing investment for your company. Based on how much your customers pay you back and based on how sharp the law of diminishing returns is for your brand, your future is determined by the decisions you make today. Said differently ... if you aren't happy with today, it is quite likely you didn't invest properly over the past five years.

As I mentioned on Friday, you can jump in on the development stage of the algorithm through this weekend at approximately 40% off (click here for the full price). By Monday, it's full price, and based on the feedback I received over the past eight days, it's gonna be a busy period!

And it's gonna be ... SO ... MUCH ... FUN ... to learn how short-term marketing investments relate to long-term business health.


May 03, 2023

Long-Term Profit Covers Up Short-Term Losses

Let's set up a relationship that we'll explore tomorrow.

Ok, here are some metrics from a marketing campaign.

  • Sales = $300,000.
  • AOV = $100.
  • Customers = $300,000 / $100 = 3,000.
  • Ad Spend = $150,000.
  • Profit Factor = 40%.

With the available metrics, we can calculate ROAS.
  • ROAS = $300,000 / $150,000 = $2.00.

Oooooh ... not good.

Let's calculate profit:
  • Profit = $300,000 * 0.40 - $150,000 = $120,000 - $150,000 = ($30,000).

We lost $30,000. No bueno.

The key here is to map profit to customers. We had 3,000 customers purchase.
  • Profit per Customer = ($30,000) / 3,000 = ($10.00).

There it is! That is the number that matters. Not ROAS. Profit per Customer. We lost $10.00 to generate each customer who purchased from the campaign.

The secret now is to calculate how much we increase customer spend in the future as a consequence. There are two parts to this ... any new customer delivered via this campaign has a downstream value that is easy to quantify ... and any existing customer migrates to a higher segment and the incremental future value of that segment less the incremental future value of the segment the customer previously belonged to contributes to the CLV delivered by the campaign.

Let's assume the weighted average of the two audiences yields the following:
  • Year 1 Profit = $18.00.
  • Year 2 Profit = $11.00.
  • Year 3 Profit = $7.00.
  • Year 4 Profit = $5.00.
  • Year 5 Profit = $3.00.

The customers who responded to the campaign deliver $44.00 of future variable profit, with $18.00 coming in the first year. This more than offsets the $10.00 you lost per customer in the campaign itself.

I mean, you invest $150,000, you lose $30,000 on the campaign, and then you make 3,000 * $18.00 = $54,000 ... your campaign pays you a 16% interest rate over the course of a year. And after that you keep producing interest.

So yes, long-term profit covers up short-term losses.

How much more long-term profit is generated? In other words, could we spend more than $150,000, get even worse short-term results, and still come out ahead over time? We'll have a different example tomorrow that answers the question, as we build out our framework for Marketing Budget Experiments.

May 02, 2023

ROAS Converted into Profit ... Short-Term Profit

In this example, I depict three different relationships.


ROAS is in turquois. This company spends $100,000 on digital marketing, and we can see how ROAS changes as the company spends more and more on marketing (yes, you should be varying your marketing spend on an experimental basis so that you understand what happens when you greatly increase/decrease marketing spend).

When you obtain profit factors from your Finance team, you can convert ROAS to Profit per Customer or Profit per Order. That relationship is depicted in blue. Spend more, generate less profit per customer/order.

The maroon-thin line shows the incremental profit generated per customer for each additional $10,000 of marketing dollars spent. This number drops below $0 at $40,000 of marketing spend ... right around a cumulative (not incremental) ROAS of $4.00.

You are halfway toward an actionable outcome. Many digital marketers stop here, seeking to generate sufficient ROAS on efforts to guarantee profit.

This guarantees profit on individual campaigns.

Does it guarantee profit over time, and yield a healthy brand?

Absolutely not.


May 01, 2023

ROAS-Based Digital Marketing

ROAS. Return on ad spend. The inverse of the old-school 1980s catalog metric called ad-to-sales ratio (yes, they are the exact same thing).

It's a metric that dominates digital marketing. If you don't have access to profit information (or gross margins at bare minimum), it's the metric of choice. It correlates directly with profit, so it is a metric that has value.

Your challenge (and you already know this) is that you don't truly know if a ROAS of $14.00 or $2.75 is appropriate. You know $14.00 is likely profitable ... highly profitable. You know $2.75 is probably marginally unprofitable ... but is that bad?

Tomorrow, we'll explore math that reveals how much we've been deluded to think that we must have a high ROAS or we are failures as marketing professionals. All of this is leading us toward the value of Marketing Budget Experiments.

Winner Stability

There are pros and cons to what I call "winner stability". This metric captures the rate that last year's winning items mainta...