May 31, 2021

We're Digitally Native, We'll Open Some Stores!

There's nothing the Omnichannel experts love more than a "digitally native" brand opening a store.

  • "It's proof that the Omnichannel approach to sales is the correct approach."
Alright.

None of what the "experts" say matters.

What matters is if you generate incremental sales that cause an increase in profit.

That's all.

If you do that, open as many stores as you like.

If you don't do that, stop opening stores and figure out something else.

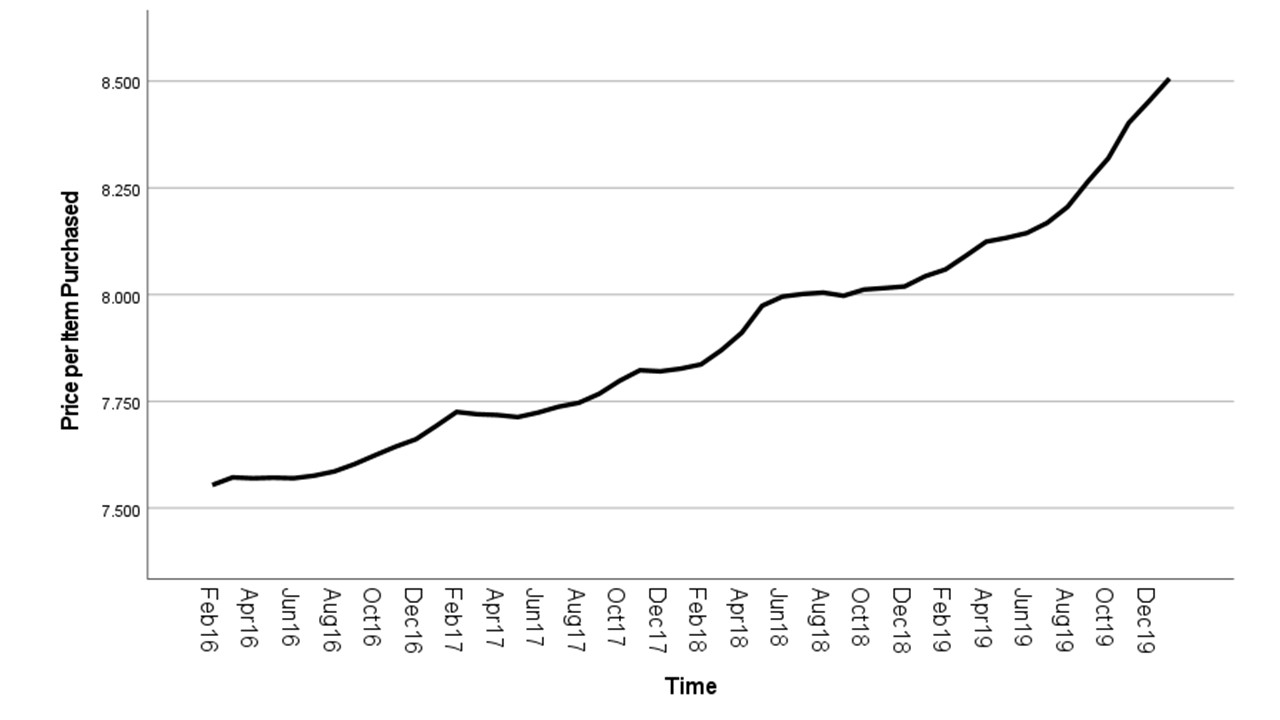
Here's some actual data from a brand that decided to open a store within a zip code. Sales within the zip code are depicted here.

Your Customer Development Analyst produces these graphs by Zip Code, right? The green line represents direct-to-consumer channel sales on a rolling twelve-month basis. Look at what happens when the store opens in or around month 31 ... direct-to-consumer sales decrease.

Yes.

When you open a store, some customers who bought from your website switch to the store, and spend less online as a consequence.

In other words, the store you open must generate enough sales to offset the sales cannibalized from your website. If the store can do that in a profitable manner, go open more stores.

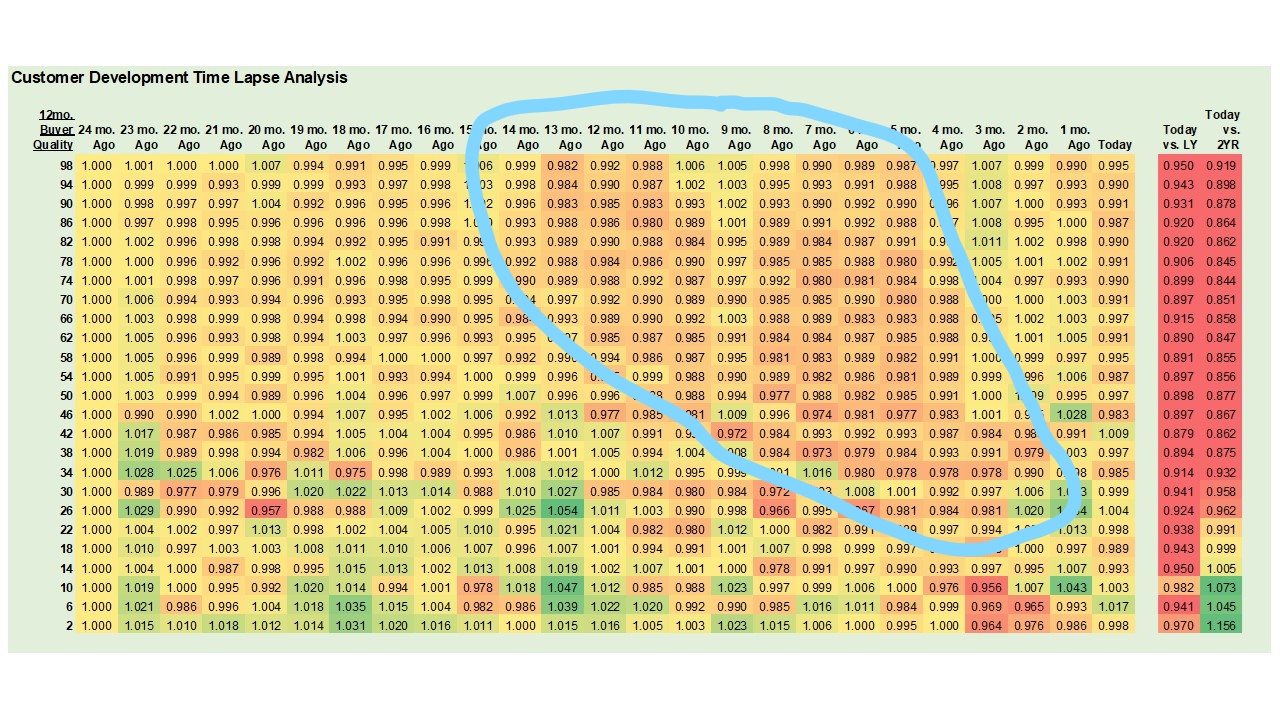
When you open a store, you perform your Customer Development Analytics (CDAs) at a Zip Code Level. You want to see if you generate more profit at a Zip Code Level.

You're doing this stuff, right?


May 30, 2021

Dear Catalog CEOs: Paper, Product, Prices

This letter is for the third(ish) of my audience that have a strong heritage in catalog marketing. If this isn't your thing, delete, and come back tomorrow.


Dear Catalog CEOs:

Let's see if I've got this right.

  1. You got your panic-centric email from Midland Paper. I have a lot of opinions about the printing industry, none of those opinions are productive.
  2. Your merchandise is sitting on a ship off the coast and you're being asked to pay more to ship stuff from China that may end up sitting on a ship off the coast.
  3. You're going to have to increase prices to offset increased costs.
The paper issue is the least of your problems. Ignore it. You have your mail/holdout test results, and you could cut 40% of your circulation and not see much impact while being so much more profitable. Stop worrying about your vendor partners and start worrying about your customers.

Speaking of customers, when you pass along all of these added costs, you're going to have a difficult situation. That situation is called "inflation". I went to Safeway a few days ago and two bags of groceries cost me $114. Needless to say I am more careful now, buying fewer items. As prices increase, items per order decrease. In other words, you offset the gains generated via price increases by driving down rebuy rates, orders per buyer, and items per order.

Ultimately, your paper problems and your pricing problems become the same problem.
  1. You may well be forced to increase prices.
  2. The increase in prices depresses customer response.
  3. Depressed customer response requires you to save money somewhere ... that's where you will put less paper in the mail ... allowing you to balance profitability.
The wild card?

Post-COVID, customer response may temporarily surge, masking the impact of potential inflationary issues.

Or, Post-COVID customer response may revert back to February 2020 levels, multiplying the impact of potential inflationary issues.

Analyze the living daylights out of this issue, folks.

Look at rebuy rates, orders per buyer, items per order, and price per item purchased by merchandise category. Build a relationship between price and overall customer productivity. Make sure you understand the Customer Development issues associated with inflationary concerns.


P.S.:  The digital gurus are at it again ... this time Amazon is going to take the bandwidth you purchase ... up to 500mb per month, and potentially allocate it to Amazon devices in nearby homes (click here). It's the modern version of a neighbor asking you if you have a cup of sugar ... but with the twist that the neighbor doesn't ask for it while a third party does it behind the scenes and vacuums up the data for their own benefit. What could possibly go wrong?

May 26, 2021

Summer Schedule

We've made it to Memorial Day Weekend. Our second straight one without a pure, normal life.

But that doesn't mean that my posting schedule has to change. Most summers I've posted on Monday Morning, Tuesday Morning, and Thursday Morning. That's what I will do this summer as well, allowing for additional posts as circumstances warrant.

Try to have a fun weekend. We'll get busy again early next week, ok?


P.S.: Yes, I'll do a few things this summer that are non-traditional in nature. That makes summer a bit more interesting, correct?

May 25, 2021

Lifetime Value and Customer Development

Lifetime Value ... known as LTV in the early 1990s and frequently known as CLV today (Customer Lifetime Value), is the outcome of Customer Development efforts.

It is common for "brands" to measure lifetime value on a twelve-month basis, then invest in new customers by spending all of the profit generated by the new customer in the first full year on the file. In other words, the "brand" is willing to lose $18 profit acquiring the customer as long as the customer pays the "brand" at least $18 of profit in the next year.

I'm frequently surprised to hear companies tell me that they are disappointed with the lifetime value metrics generated by their in-house analysts. They'll argue that the measurements are flawed or that the payback windows are not appropriate.

All of this is nonsense, of course.

What the Executive is grumbling about is this ... the Executive is grumbling that her employees are doing a poor job of Developing Customers.

Few people want to face this reality.

But that's what is happening.

If you want great lifetime value metrics, get busy prioritizing the Development of your Customers.

May 24, 2021

One More Week To Sign Up For The Elite Program

If you want to participate in the June run of The MineThatData Elite Program, you've got one more week to email me and participate!

In addition to the usual information provided in each run, I will provide you with a Time Lapse Analysis of your twelve-month buyer file, so that you can see if your efforts are resulting in more good customers over time.


As we emerge from the dire canyon of the COVID era, many e-commerce brands will face a crossroads ... easy growth via quarantined shoppers ends and Development of the Customers you have begins (if it hasn't already begun).

Cost = $1,800 for first-time participants, $1,000 for repeat customers.

Data is due by June 15.

Payment is due by June 15.

Analysis is completed by June 30.

Contact me now (kevinh@minethatdata.com) for details.


May 23, 2021

Every Unit Matters

I once worked with a Vice President who always said ... "units = customers". He said this because he strongly believed that a brand must have low price point items in the assortment to appeal to shoppers. If you had low price point items that a lot of customers purchased, you had a good Customer Development situation.

I wondered whether his comment made sense or not, so I ran a logistic regression equation to validate if the statement had merit. The equation predicted rebuy (yes/no) in the next year based on four variables.
  • Units sold in the past year on low price point items.
  • Units sold in the past year on medium price point items.
  • Units sold in the past year on high price point items.
  • Dollars spent 13-48 months ago (divided by 1,000).
Units fell into three categories, with breaks at $6.50 and $13.50. After averaging the dollars in each category, low price point items averaged $5.00 each, medium price point items averaged $10.00 each, and high price point items averaged $18.00 each.

What were the results of the logistic regression analysis?


What do the coefficients mean?

The results are fascinating!

If a customer bought a high price point item (average = $18), the customer had about the same chance of repurchasing as if the customer bought a low price point item (average = $5). And if a customer bought a mid price point item (average = $10), the customer had the best chance of repurchasing again next year.

In other words, how much a customer spent was irrelevant among twelve-month buyers. What mattered is that the customer bought units ... not dollars.

Units. Not dollars.

Maybe that Vice President was on to something back in the day. Maybe every unit does matter.


P.S.: Yes, I realize that your mileage will vary. And yes, I realize that if you can't make money on low price point items then you can't sell those items. Put those thoughts aside for just a moment today and take a moment to think, ok?


May 20, 2021

This Problem Comes Up All The Tme

Our Time Lapse Analysis indicates problems.

Now, the problem featured below comes up all the time. What do you think the problem is?


Yeah, it is price points.

Here's what happens:  When you increase prices, customers do one of two things. First, they frequently buy fewer items. This doesn't manifest itself in the Development of your Customer File. What does manifest itself is fewer buyers. As prices increase, it is common for it to become harder to find new/reactivated buyers, and it is common for existing buyers to repurchase at lower rates. Both issues rear their ugly heads via poor Customer Development.

We all understand why prices have to increase (in many cases).

But there is frequently a backlash, and that backlash is felt in your Customer Development work.


May 19, 2021

Diagnosing Problems

Remember our Time Lapse Analysis?

There's plenty of bad news in the Time Lapse analysis. We can see that the top 60% of the file contracted about 5-13 months ago.

This is where I like to diagnose problems with my Comp Segment framework. I look at performance among 2x buyers (in the past year) and counts of new + reactivated buyers.


We quickly observe two issues ... a merchandise productivity issue starting about five months ago (correlating strongly with the Time Lapse Analysis), and a significant new + reactivated buyer issue.

In many projects it becomes necessary to combines aspects of the Total Package project and the Customer Development project. We need to understand and explain why the Time Lapse Analysis and the Master Sheet indicate negative trends.


May 18, 2021

There It Is

In case you missed the "danger zone" in the Time Lapse Analysis yesterday, I circled the result for you today.


Between five and thirteen months ago, there was a "weakness" that resulted in the top 60% of the twelve-month buyer file to contract. Either the brand reduced marketing expense (unlikely) or merchandise failed (much more likely).

In these projects, it's usually obvious to the client what went wrong and what needs to be done to fix the problem. I'll frequently complement this analysis with a comp segment analysis so that we can identify merchandising issues that impact Customer Development.

Bad Merchandise = Fewer Customers.


May 17, 2021

What Does Customer Development Failure Look Like?

It kind of looks like this (actual data):

I mean, this is awful.

The top 60% of the file has about 10% fewer customers in the past year than the year prior to that, and about 15% fewer customers in the past year than two years ago.

Do you see any green cells in the top 60% of the twelve-month buyer file? Just three months ago, that's about it.

This company is doing an AWFUL job of Customer Development. Just AWFUL. The company has basically failed to improve counts among the top 60% of the twelve-month buyer file for twenty-three of the past twenty-four months.

Unacceptable.

Are you running a Time Lapse Analysis? No? Why not?

Contact me (kevinh@minethatdata.com) if you aren't doing this. Let's get started figuring out what is happening to your Customer Development efforts.


May 16, 2021

It's Time Again!

Four months flies by ... even in the era of COVID!

It's time for the next run of the MineThatData Elite Program ... an ongoing subscription program that has turned an amazing five years old!!

In this run, you'll get the standard analytics you've grown to know and love - comp segment analysis, rolling twelve-month buyer analysis, annual file analytics. 

The special add for this run? You guessed correctly ... it's the Time Lapse Analysis! You'll get to see if your Customer Development efforts have made a difference or not over the past four months.

Cost?
  • $1,000 for existing subscribers.
  • $1,800 for first-time Elite Program members ... then $1,000 per run thereafter.
Key Dates:
  • Announce your participation by June 1.
  • Payment is due by June 15.
  • Data is due by June 15 (five years of data through May 31).
  • Analysis to be completed by June 30.
Let's go ... who wants to learn something??

May 13, 2021

Does This Company Do A Good Job Of Developing Customers?

What do you think?

There isn't any evidence in the table above that this brand does a good job of Developing Customers. In a Time Lapse Analysis, we should see bigger increases in customer counts at the top of the table than at the bottom of the table.

The two columns at the far right of the table show year-over-year and year-over-two-years-ago indexed gains by customer segment. Most of the gains are in the bottom-middle portion of the table, suggesting that the gains in counts are likely customer acquisition driven.

Gains do happen, however, and are (in this case) driven by the COVID-bump experienced by so many e-commerce brands in 2020. Watch how some of those gains move diagonally from top to bottom, from left to right ... meaning that new customers were acquired and those new customers did not repurchase, thereby fading in customer quality.

Time Lapse Analysis is a key component of your Customer Development work. Be sure to run your Time Lapse Analysis right now ... and if you don't have the resources to do it, contact me (kevinh@minethatdata.com) and I will craft a Customer Development project for you. 


May 12, 2021

Key Findings In The Time Lapse Analysis

Here's our Time Lapse Analysis from the past two days.

Remember, green cells indicate areas of the customer file that are growing. Red cells indicate areas of the customer file that are on the decline.

We read across the table from left-to-right. Each month that passes is recorded in the table. We get a two year view of overall Customer Development, coupled with two summary columns at the end of the table comparing this year to last year, and this year to two years ago.

What do you see as you read across from left to right?

Well, you see a lot of orange/red, don't you?

This means that the customer file was shrinking. This company was failing in Customer Development activities (or failing at developing credible merchandise).

Are the orange/red cells evenly distributed from top to bottom? The answer is mostly "yes". This means that this brand is failing across all customer segments ... great customers, average twelve-month buyers, newer twelve-month buyers.

Notice that about eight months ago the trend changes ... changes in dramatic fashion. All of a sudden this brand has significant gains in customers, across the board but more heavily weighted in the middle of the table. Hint - this is when COVID started, and this is when this brand experienced big gains.

Notice that the green boxes tend to have a diagonal trajectory (from top to bottom, from left to right). Those are customers who buy and then don't buy again, thereby fading in terms of customer quality.

Companies that do a great job of Developing Customers have a stronger hue of green at the top of the table than at the bottom of the table.

Companies that do not Develop Customers have uniform colors from top to bottom.

Where does this brand fall on that spectrum?


May 11, 2021

Calculating The Metrics in a Time Lapse Analysis

There are several key components of a Time Lapse Analysis.


First, I tackle the concept of "weighting". I create a regression model that weights historical dollars in terms of how much historical dollars contribute to future spend. For instance, a purchase in the past month might count for a weight of 1.000 ... a purchase twelve months ago might count toward a weight of 0.50. The purchase 12 months ago is half as important as a purchase yesterday.

Here's an example. Say we have a customer who spent $100 one month ago, $100 six months ago, and $100 twenty-four months ago. Say that the weights are 1.00 for one month ago, 0.65 for six months ago, and 0.30 for twenty-four months ago. Weighted spend is 100*1.00 + 100*0.65 + 100*0.30 = $195.

I sum weighted spend for every twelve-month customer.

Then I create twenty-five "tiles" ... four percentile groups of customers, based on weighted historical spend.

I count how many twelve-month buyers reside in each of the twenty-five "tiles".

I then replicate this analysis twenty-four more times, going back in time on a monthly basis.

Say I have 10,000 customers in the top 4%-tile as of today. Say I had 9,800 customers in that tile a month ago. My index becomes 10,000 / 9,800 = 1.02.

Any index > 1.00 is progressively greener in the image above.

Any index < 1.00 is progressively more red in the image above.

More on the Time Lapse Analysis tomorrow.


May 10, 2021

The Time Lapse Analysis

If you do a credible job of Developing Customers, you'll see your success via what I call a "Time Lapse Analysis".

Here is the image we'll discuss the rest of the week.

The goal of the Time Lapse Analysis is to see how customer counts change over time by quality of customer. If you are Developing great Customers, you'll see more greens in the top rows of the table. If you are failing, you'll see more orange/red colors in the table.

More on the Time Lapse Analysis tomorrow.


May 09, 2021

Who Should You Offer Discounts To?


The responses were interesting.

Some thought that you never offer discounts/promotions to loyal customers because you give up precious gross margin dollars.

Some thought that you never offer discounts/promotions to prospects because that isn't fair to loyal customers paying full price.

Nobody offered actual customer data from Customer Development work that proved what you should and should not do.

Think carefully about your discounting efforts in terms of Customer Development. There are few things that marketers can muck up more than the development of customers by treating some better than others.

May 06, 2021

Practice

In Pickleball we practice. We drill, we experiment while we play in recreational games, we try out various strategies so that when we are playing in a tournament we have a full arsenal of strategies at our disposal.

Customer Development should be viewed the same way. You should employ all sorts of tests and experiments, with the most successful attempts folded into your daily Customer Development strategy.

All too often, I hear an Executive say "show me a Customer Development strategy that works". That's a Professional who isn't willing to risk anything. What we should hear is "we experimented and learned that tactics "A" "B" and "C" worked, and we are rolling those tactics out to our customer base".

May 05, 2021

Some Channels Yield Really, Really Lousy Customers

Think about it this way. A football team drafts players, and those players are not great players, so the football team goes 5-11 for a few years. What happens? The coach is fired. The General Manager responsible for the awful outcome is fired. The new coach and GM have to live with these players for a few years until they can turn over the roster.

Like the NY Jets, right?

The same thing happens in e-commerce. We acquire customers, and then we're stuck with those customers for a few years. If those customers don't perform, if they cannot be Developed, then the marketer or analytics expert or e-commerce executive is fired.

So why would you knowingly acquire customers who you know won't repurchase again? To generate short-term profit? Sure, go ahead. But that doesn't allow your company to achieve lofty goals, does it?

This is actual data from a brand. Here are annual rebuy rates for customers acquired via various channels.

  • Website Unsourced = 25%.
  • Paid Search = 27%.
  • Catalog = 27%.
  • Email = 27%.
  • Retail Store = 34%.
  • Online Events = 23%.
  • Customer Service Associate = 12%.
  • Social Media = 19%.
In this case, when a customer has a question and doesn't necessarily trust the item the customer is purchasing, the customer speaks with a Customer Service Associate. Those customers don't come back.

Neither do the customers who buy via Social Media (in this case ... in other project, holy cow, those Instagram-sourced buyers are fabulous).

Store customers, however, are most likely to repurchase (in this case).

Your mileage will vary.

But the need to perform this style of analysis is undeniable. Some channels yield really, really lousy customers.

May 04, 2021

Why Are You Featuring Certain Items To First-Time Buyers?

Here's actual data from a brand. I took all first-time buyers, I looked at the products those customers purchased, and then I measured whether the customer who bought the item repurchased within a year. With this data, I aggregated it to one row per item, measuring the repurchase rate of the items sold. Look at the histogram of annual rebuy rates.


The average item generates a new customer who has a (in this case) 26% chance of buying again in the next year.

Some of the items purchased by first-time buyers lead to outstanding levels of Customer Development, generating customers who have a 40% or better chance of buying again in the next year.

Some of the items purchased by first-time buyers lead to awful levels of Customer Development, generating customers who have a 15% or less chance of buying again in the next year.

Why would you feature items that lead to new customers who have a 12% chance of buying again? Yeah, I can hear you all the way from New England as I type this, yelling at me that those items are profitable. That's a merchandise-first view of the world. That's not how you Develop Customers, however.

Why would you feature a middling item (in terms of the rebuy rates generated by the item) in an email campaign at 30% off if the item yields Customers unwilling to be Developed? Think about it ... maybe the reason you are forced to give customers 30% off is because you loaded your customer files with Customers who are unwilling to be Developed ... because of some of the products you offer.

Or because of the channels where you market to customers. More on that topic tomorrow.


May 03, 2021

A Strong Customer Development Plan

Yesterday I showed you a situation where a brand had no Customer Development Plan to speak of. When that happens, the same items sell at the same rate across all customer segments.

 
When every item sells at the same rate across all customer audiences, your failed to find ways to customize your assortment and thereby facilitate the development of customers.

The table above represents actual data for the top 25 items selling at a specific brand.

The table below represents actual data for the top 25 items selling at a brand that knows how to Develop Customers.


The 10th best selling item (overall) is the 6,957th best selling item to the Acquisition Audience, and is the 1,713th best selling item to the Welcome Audience. Among Loyal buyers? It's the 3rd best selling item.

This is what it looks like when you are fusing your Merchandising and Customer Development strategies. You pick and choose the products that appeal to customers based on different life cycle situations.

Does that make sense?


May 02, 2021

No Customer Development Plan

It's pretty easy to tell when a company doesn't have a Customer Development Plan.

How can I tell?

You take a look at the merchandise sold by a brand, and you rank-order the items from best to worst for the following:

  • Overall Performance.
  • Performance Among the Acquisition Audience.
  • Performance Among the Welcome Audience.
  • Performance Among the Emergence Audience.
  • Performance Among the Loyal Audience.
Here's an example ... actual data.


There is almost no difference whatsoever between audiences. None. The same items sell well across all audiences.

When a brand is lousy at Customer Development, the same items sell at the same rates across all audiences.

When a brand is fabulous at Customer Development, different items appeal to different audiences. The brand uses personalization and marketing strategy to get certain items in front of loyal buyers, while featuring the items that generate long-term loyalty to first-time buyers.


Items That Appear In Multi-Item Orders

In a typical Life Stage Analysis within a Merchandise Dynamics project, it is common to see exaggerated trends when comparing first-time buy...