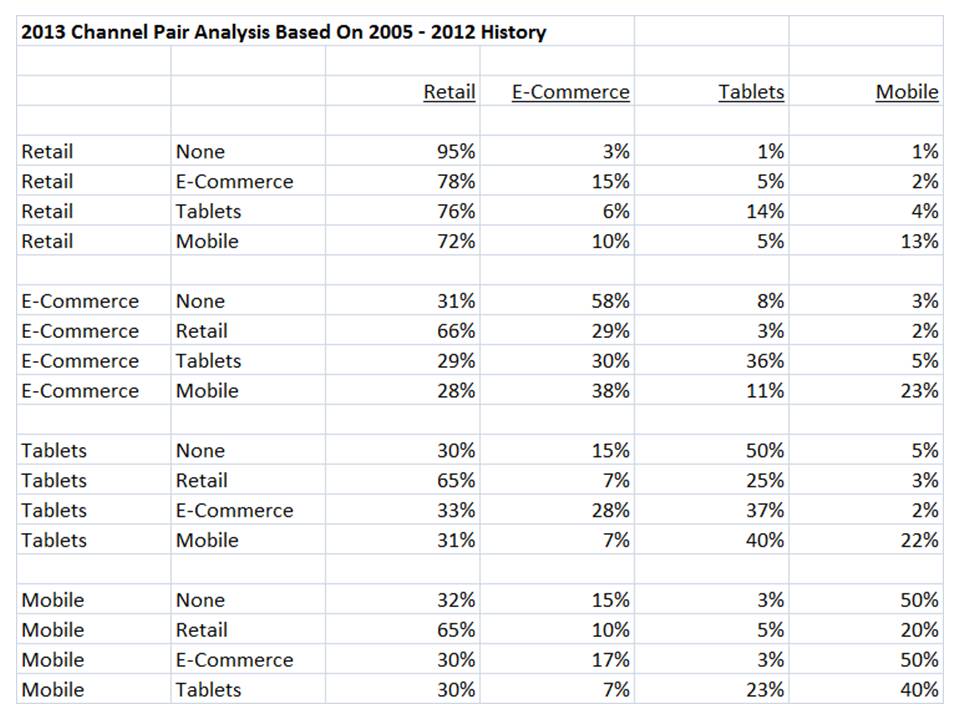
I want to wrap up this series by analyzing four unique channel pairs.
Take a look at any row in the table that has "None" in the second column. These are customers that only buy from one channel.
By the way, the majority of customers in your database only buy from one channel. We spend all of our time analyzing omnichannel customers, when in reality, we should be spending a disproportionate amount of time analyzing single-channel customers!
Retail Only Buyers: 95% of future demand is in-store. This tells us that, for these customers, digital is there to support the in-store experience. I know, the experts don't want to hear this, but analyze your own data, and you're likely to see a similar outcome. For retail brands, most of the customers are retail-only, and most of the future sales from this audience are in-store. The digital experience supports in-store purchasing activity, an important strategic finding.
E-Commerce Only Buyers: 58% of future demand is via e-commerce, while 11% is via tablets/mobile. About 20% of future online activity is bleeding out of e-commerce, into newer digital channels. Unless mobile/tablet customers migrate back to e-commerce at the same rate, e-commerce is dying a slow death. You don't hear the pundits talk about this, because, well, digital advocates just don't want to believe this finding! Go look at your own data. What do you observe?
Tablet Only Buyers: 50% of future demand is via tablets, 15% via e-commerce ... ok, this is a very interesting finding. In reality, tablet customers are switching to e-commerce at FASTER rates than e-commerce buyers are switching to tablets. We just validated the opposite hypothesis! Now the new media pundits will get frustrated! This finding tells us that e-commerce customers want to try tablets/mobile, but may find that experience not fully developed, driving customers back to e-commerce.
Mobile Only Buyers: 50% of future demand is via mobile, 15% via e-commerce ... again, the customer is actually switching back to e-commerce faster than e-commerce customers are switching to tablets/mobile.
So this analysis didn't go where I thought it was going, when I reviewed e-commerce only buyers, did it? Fascinating! At this time, customers are switching from tablets/mobile to e-commerce faster than they are switching from e-commerce to tablets/mobile.
By the way ... the relationships in this table (above) are very, VERY similar to the relationships observed when e-commerce broke on the scene in the late 1990s ... customers left the call center to try e-commerce, then shifted back to the call center. This trend didn't hold - that's why you run this analysis every month/quarter, to understand how customer behavior is shifting.
Helping CEOs Understand How Customers Interact With Advertising, Products, Brands, and Channels
Showing posts with label Channel Pairs. Show all posts
April 11, 2013
April 03, 2013
#Omnichannel Future - Channel Pairs Part 3
We're having fun, aren't we?
Sure, I get it. It's entertaining to hear omnichannel thought leaders describe improbable versions of a gloriously digital future.
It's more appropriate, however, to analyze your own data, and make your own decisions based on how your own customers are behaving.
So let's do more of that. Take a look at the Mobile / Retail row of the table. These customers spent more money on mobile phones than any other channel.
Take a look at where these customers migrate, in the future.
Sure, I get it. It's entertaining to hear omnichannel thought leaders describe improbable versions of a gloriously digital future.
It's more appropriate, however, to analyze your own data, and make your own decisions based on how your own customers are behaving.
So let's do more of that. Take a look at the Mobile / Retail row of the table. These customers spent more money on mobile phones than any other channel.
Take a look at where these customers migrate, in the future.
- Retail = 65%.
- E-Commerce = 10%.
- Tablets = 5%.
- Mobile = 20%.
This tells us a lot about how we'll prioritize future strategies. Retail, clearly, is the driver among this customer audience. For this business, retail isn't dying. Retail, instead, is the "sun" of this solar system.
More important, however, is the relationship between mobile and e-commerce. Notice that, in the future, these customers spend twice as much via mobile as they spend via e-commerce.
For this customer segment, the future aligns with an in-store experience supported with mobile. The e-commerce channel, surprisingly, is the one that is dying, not the in-store experience.
This data is readily available in your customer database. Go analyze it! The secrets of your business lie in your own customer database.
March 28, 2013
#Omnichannel Future - Channel Pairs Part 2
Let's take a look at another channel pair.
Review the E-Commerce / Tablets row. This is an interesting row, because these customers have spent more, historically, on e-commerce than on tablets. The key with this row, of course, is what these customers do in the future.
Take a peek at the future.
Review the E-Commerce / Tablets row. This is an interesting row, because these customers have spent more, historically, on e-commerce than on tablets. The key with this row, of course, is what these customers do in the future.
Take a peek at the future.
- Retail = 29%.
- E-Commerce = 30%.
- Tablets = 36%.
- Mobile = 5%.
Ohhhhh, this result is absolutely delicious, isn't it?
The historical preference is e-commerce. The future preference is a mix of retail, e-commerce, and tablets, with a skew to tablets.
This illustrates a customer that is in transition ... the customer is slowly switching from e-commerce to tablets. This tells you that your tablet-based investments are appropriate. Just as important, the customer spends nearly 30% of future volume in stores, telling you that you must have synergy between retail and tablets.
Next week, we'll analyze additional channel pairs. It should be obvious to you, by now, that channel pairs help us visualize how our customers are evolving and changing, providing us with the information we need to determine future strategies.
March 27, 2013
#Omnichannel Future - Channel Pairs
If we want to understand what our omnichannel future holds, we should look at our own customer data for clues.
Many of us now categorize physical channels based on a Retail / E-Commerce / Tablets / Mobile Phone framework. Using this framework, we can see how trends are playing out.
Take a look at the Retail / Mobile channel pair ... the fourth row in the table. These customers spent more weighted dollars in retail than any other channel, with mobile phones in second place.
Many of us now categorize physical channels based on a Retail / E-Commerce / Tablets / Mobile Phone framework. Using this framework, we can see how trends are playing out.
Take a look at the Retail / Mobile channel pair ... the fourth row in the table. These customers spent more weighted dollars in retail than any other channel, with mobile phones in second place.
- 72% of future demand happens in retail stores.
- 10% of future demand happens in e-commerce.
- 5% of future demand happens in tablets.
- 13% of future demand happens in mobile.
In this case, the retail/mobile customer spends the vast majority of future demand in stores. In this case, you'd say that mobile is largely supportive of the retail store experience. Given this development, you'd build a mobile experience that is highly integrated with your store experience.
Tomorrow, we'll look at another channel pair.
March 26, 2013
Where Is My #Omnichannel Business Headed? Start With Channel Pairs
An awful lot of omnichannel experts seem to know what the future holds.
Fortunately, you don't have to listen to their guesses. You have actual data, based on how your customers (not generic consumers) perform.
All you have to do is perform a weighted channel pair analysis.
Remember weighted channel pairs?
We sum weighted demand by physical channel ... for example, retail, e-commerce, tablets, and mobile.
Fortunately, you don't have to listen to their guesses. You have actual data, based on how your customers (not generic consumers) perform.
All you have to do is perform a weighted channel pair analysis.
Remember weighted channel pairs?
We sum weighted demand by physical channel ... for example, retail, e-commerce, tablets, and mobile.
- Transactions 0-12 Months Ago = Demand * 1.00.
- Transactions 13-24 Months Ago = Demand * 0.50.
- Transactions 25-36 Months Ago = Demand * 0.25.
- Transactions 37-48 Months Ago = Demand * 0.15.
- Transactions 49+ Months Ago = Demand * 0.10.
Then we rank order the pairs, based on the channels that generate the most weighted demand.
Here's an example:
- Retail 0-12 Months Ago = $100 (weighted = 100*1.00 = 100).
- Tablets 0-12 Months Ago = $40 (weighted = 40*1.00 = 40).
- E-Commerce 13-24 Months Ago = $180 (weighted = 180*0.50 = 90).
This customer possesses a Retail / E-Commerce channel pair.
Tomorrow, we'll analyze one specific channel pair.
Subscribe to:
Posts (Atom)
It's Forecast Season!
Somebody at your company sounded the alarm bells about November/December. Is that person right? Are you going to be below plan/budget? Or is...
-
It is time to find a few smart individuals in the world of e-mail analytics and data mining! And honestly, what follows is a dataset that y...
-
It's the story of 2015 among catalogers. "Our housefile performance is reasonable, but our co-op customer acquisition efforts ar...
-
The emails come in on a daily basis now ... " here's what I think I need, what should I purchase ?" So, today I write a Search...

