February 28, 2023

Same Experience Across Channels

Seamless and Frictionless? Yeah, I suppose I could sign-on for that.

Same experience? Nooooo.

Channels should have a reason for being. Each channel should be special. I worked with a tobacco brand many years ago that sent postcards featuring one product and only one product. This product belonged to a category that "fueled" other categories. Customers bought from the postcard, and that caused the customer to cross-shop in the future. The channel (postcard) had a purpose, and the purpose aligned with the category/item featured. Well done.

The same brand used email marketing as a low-price channel ... "they're all looking for deals anyway" was a common refrain.

Those of you with stores know what the investment looks like over the next 5-10 years ... you will spend a fortune literally reinventing what in-store shopping looks like. This necessary step should have happened in the past 8-13 years. It's going to happen now. There must be a compelling/entertaining reason to step in a store or why have the darn store in the first place?

Every channel should have a unique purpose or you shouldn't dabble in the channel.

Every channel has a category that thrives in the channel. Stop featuring random nonsense and learn what sells in each channel. You can do this!!

February 27, 2023

A Completely Unscientific Poll

I ran a poll on Twitter asking readers what percentage of their annual apparel purchases are in stores? 86 brave souls responded.

  • 21% said none of their apparel purchases were in a store.
  • 36% said a third of their apparel purchases were in a store.
  • 31% said two-thirds of their apparel purchases were in a store.
  • 12% said all of their apparel purchases were in a store.
If you perform a weighted average of those metrics you land at 45%.

Again, completely unscientific. Highly biased. Not actionable.

Still interesting.

The transformation that is coming for retail will be breathtaking. Retail isn't going away. But individual stores are going to go away at levels we haven't previously considered. Remember, the amount of retail square footage in the United States is way ... way ... WAY more than it is in other countries. Which means the closures will be way ... way ... way more than in other countries.

Every transformation comes with opportunity. How you merchandise a store ... how you construct a store ... how you entertain in a store ... will all be very different in ten years, by necessity. The categories you choose to feature will be different than what you feature online. The sameness we've been taught across channels is going to go away, replaced by doing what is necessary to generate $$$ in a store. You simply cannot have the same experience in every channel anymore. Cannot. 

Look at sports for examples - is the NFL Sunday Ticket experience remotely similar to attending a game? That dichotomy is coming to retail / e-commerce.

Quite honestly, it's going to be an exciting transformation.

February 26, 2023

Online / Store Relationships

The online/store relationship has gone through a transformation over the past twenty years.

In 2003, you brought in a new customer via e-commerce and that customer migrated over to the store and generally became a good store customer over time.

Not true in 2023.

In 2023, customers have preferences. There are e-commerce customers. There are clearly in-store retail shoppers who embrace that channel, and those customers are a bit less likely to cross-over and buy from e-commerce than they were twenty years ago. There are "hybrid" customers who use each channel for informational/operational purposes.

From a category standpoint, there are differences - and modern customer behavior manifests itself via a category/channel interaction. One retail brand couldn't sell extended sizes in stores - not enough shelf space. Well guess what? Categories with a ton of extended size customers skewed online. Duh! From a marketing standpoint, take advantage of that information. Teach your customers where to buy various categories. Why are you sending emails to extended size customers demanding they shop in your store when you don't carry what that customers wears in your store?

Use category information to modernize your marketing tactics.

February 23, 2023

Old Man Yells At Cloud

Service Providers / Vendors play an important role in helping my clients achieve high levels of EBITDA (i.e. profit). They are like the maze of third parties that make it possible for Boeing to build an airplane. Take them away, and you don't have an airplane. Really ... really ... important.

When third-parties mess up, airplanes crash.

It is up to Boeing to make sure that third-parties perform at the highest possible level. When a third-party makes consistent mistakes, Boeing finds a new partner.

There are times when vendors make mistakes in our industry. Gonna happen. Unavoidable.

When I bring up the topic of vendor accountability, reader response goes something like this:


Mistakes are going to happen. Work carefully with your partners when consistent and similar mistakes continue. Encourage good performance. Your vendor partners are extensions of your employee base. Treat them as such.

February 22, 2023

Free Bacon

If you're gonna develop a category, do it this way ... free bacon (click here).

I had a two-hundred-slide-deck about seven years ago with these kind of ideas to generate awareness. Y'all HATED it. Didn't like any of the ideas. "That won't work for a brand with our sensibility."

Ok.

Well then what WOULD work?

Do you think Smithfield earned some awareness from this promotion?

February 21, 2023

A Completely Opposite Situation

Here is a repurchase analysis for Category 4. Tell me if you see any differences between this category and the one we viewed yesterday (Category 6):


11% ... just eleven percent ... of sales are generated from customers who bought from the category last year. Wow!

15% of sales are generated from customers who bought from other categories last year.

A whopping 74% of sales were generated from customers who were new/reactivated in the past year.

Describe for me your email marketing strategy if your desire is to grow sales in Category Six?


February 20, 2023

A Category That Owns Customers

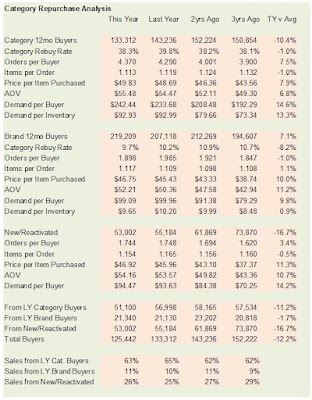
In our study, here is a repurchase table for Category 6.


There is a lot of data to digest here.

Let's go right to the bottom of the table.

Category 6 generated 63% of sales from last year's category six buyers. It generated 11% of sales from buyers of other categories. It generated 26% of sales from new/reactivated buyers.

Once you know that a category generates most of sales from prior buyers, how does your email marketing (or if you are a cataloger, print marketing) tactics change?


February 19, 2023

A Plethora of Options

Here is updated pricing on new projects for 2023 (click here):

A few notes:

  • The "QuickScores" project can be expanded to model customers who are likely to return too much merchandise and therefore should not be emailed. I've been associated with situations where company profit is increased by 10% by not marketing to high returns customers. You're probably already doing this ... but if you aren't already doing this, contact me right now (kevinh@minethatdata.com).
  • Customer Development + Category Development ... work on both projects at the same time and you save 25%. That's a deal.
  • For $29,000 I will create catalog scores that tell you how many times to mail customers on an annual basis. Show me how many vendors will do this for this low cost? If you are looking to reduce catalog marketing expense (and how many catalogers are looking to accomplish this ... a lot!), contact me right now.
  • If you are looking to forecast where your brand is headed in 2023, check out the forecasting section of the link above.
P.S.: I currently have one (1) open slot for March ... I typically work on two large projects per month and just had an opening created. Take advantage of the opportunity before it disappears!

P.P.S.:  If you are a startup with < $10,000,000 in annual sales, you qualify for my $5,000 startup fee.

February 16, 2023

Newness Matters

You probably already know the percentage of sales of items by category that are new in the past year. The table looks something like this (here, I had 5 years of purchase history so the 4th-5th year is not applicable).


Here we see a brand in disarray. Look at Category 2 ... somebody decided that newness was important last year. Look at Category 4 ... somebody decided there was too much newness and scaled back. Look at Category 8 ... pure chaos, nobody knows what the "right" answer is. Look at Category 12 ... the category is being slowly starved of new items over time.

This is one of those situations where you don't have a strong Chief Merchandising Officer.

You can tell when there is a strong Chief Merchandising Officer, because the differences by category are much more consistent than what is illustrated above.

Now, you don't necessarily need a strong Chief Merchandising Officer. Or, the measure of "strength" is wrong ... a quality CMO might let his/her underlings make independent decisions (if that is the right thing to do). But you have to know what is right for your brand, and then guide your merchandising team toward the right path.


February 15, 2023

Developing Categories via Discounts

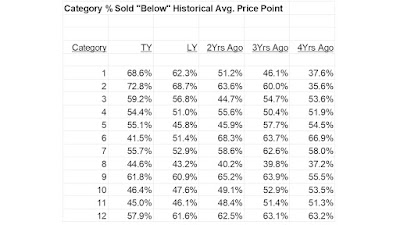
Back to the brand we were studying. Look at the percentage of sales generated below the historical average price point by Category:


Look at Category 2. As a marketer, I'd have a discussion with the head of this Category. Why is this person discounting everything? And if the marketer is the one discounting this category, then the merchant needs to have an honest discussion with the marketer ... "why are you destroying the integrity of my category?"

There are so many instances in our modern world where a merchant needs to sit down with a marketer and have an honest discussion about the incessant discounting marketers crave. Teaching a customer to value a category only when there is a promotion is teaching a customer the wrong lesson.


P.S.:  I once worked with a Chief Merchandising Officer. This woman told me that it was her job to ask marketers questions, and when the answer to the question wasn't to her liking, it was her job to roll up a newspaper and swat the marketer across the forehead with the newspaper. Yeah, times were different in the 1990s.


February 14, 2023

Merchandise/Category Solar System

It's becoming clear that all of your Category Development work is dependent upon having a viable Merchandise Solar System.

In other words, you have a category that most customers prefer to purchase from. This is your "Star". Everything revolves around the Star.

You have planets. Planets revolve around the star, but planets have their own moons as well. For instance, in an apparel brand you might have Mens Casual ... that would be a planet that revolves around the Star (Womens Casual, for instance), but Mens would have moons as well (Mens Outerwear, Mens Footwear).

You have comets. Comets have unusual orbits and they come in-and-out at odd times. Think about certain Christmas gifts you might sell ... these items are irrelevant the entire year and then for six weeks they appear with a green tail, not to be seen again after December 20th(ish) ... until the following Christmas season.

Once you understand what your Solar System looks like, you make smarter decisions. Want to sell more Mens Outerwear? Sure, you can pay for keywords, or you can develop Mens Casual so that you have more "pre-qualified" customers who want to buy Mens Outerwear. The latter point is frequently missed among marketers. Use your categories appropriately and you can grow a moon-level category by growing a planet-level category, and the planet-level category can be grown by attracting customers to your "Star".

Your own Category Development project (click here) helps you get started on this journey.

February 13, 2023

Valentine's Day: A Category Comet

Tomorrow I'll share a bit more about Stars / Planets / Moons / Comets / Asteroids and how the concepts fit into a Category Solar System.

Valentine's Day is an interesting concept. Some brands specialize in gifts for different occasions. If you have a category called "Flowers", you probably spread out purchases across several occasions, and you have a Planet.

But if you have a category called "Valentine's Day Flowers", well, now you have a Comet. The customer only needs this product once-a-year. And if you cannot convince the customer to purchase anything else during the year, then the category becomes a Comet ... and kind of hurts your brand.

You want customers who have reasons to purchase four times a year ... and if categories work against this goal, the category might still be viable (i.e. highly profitable).

Or, the category might not belong in your assortment.


P.S.: This is where somebody should be asking a question ... "What if our category hierarchy is flawed? Shouldn't the analyst fit the assortment together based on the products that tend to sell together at certain times of the year?" Yes, somebody should be asking that question!

February 12, 2023

Category Development and Discounting

Let's take a look at discounting within the framework of our Category Development work. Here's the table we've been reviewing for a week now (yeah, just one table).


The final column in this table is "% Sold Below Av.". Here, we calculate the percentage of sales within a category that are sold below the historical average price point of an item.

For instance, pretend that an item sells for $50. The brand discounts frequently. Say that 10 customers purchase one of this item each, at the following prices.

  • $50.
  • $50.
  • $45.
  • $40.
  • $40.
  • $35.
  • $35.
  • $35.
  • $30.
  • $25.
In this case, the item sells for an average of $38.50.

Anytime this item sells for less than $38.50, the item is selling below the historical average price point for this item.

In other words, anytime the item sold for $35, $30, or $25, the item sold below the historical average price point for this item.

Now go back to the table. What do you observe at a Category level, especially for Categories 6/7/10/11?
  • 41.5% of Category 6 sales are below the historical average price point.
  • 55.7% of Category 7 sales are below the historical average price point.
  • 46.4% of Category 10 sales are below the historical average price point.
  • 45.0% of Category 11 sales are below the historical average price point.
Yeah, this brand discounts the living daylights out of products. It's "who" this brand is.

Later, I will run models that determine if incessant discounting helps or hurts future profit. In most of my projects, incessant discounting is negatively correlated with future profitability.


February 09, 2023

We're Still Not Done With This Table, Are We?

We've spent nearly a week studying one simple table. One week!!


Remember:

  • Category 11 is the Sun in the Category Solar System.
  • Categories 6/7 are Major Planets.
  • Category 10 behaves like a Comet, not interacting a ton with other Categories (based on what we've witnessed thus far).

"% New Merch" represents the share of sales last year within the Category that came from items that were new in the past year. Let's look at our four key Categories.
  • 39.6% of Category 6 sales come from items new in the past year.
  • 8.0% of Category 7 sales come from items new in the past year.
  • 4.6% of Category 10 sales come from items new in the past year.
  • 13.0% of Category 11 sales come from items new in the past year.

The product development folks appear to be losing their battle. They are developing several Categories (2/3/4/6/8/9). But only one of the four key Categories is being developed.

Having worked on a ton of this stuff over the past decade, it is generally true that if you fail to develop new products/merchandise/items today, you will have a sales problem tomorrow.

In these projects, I'd need to have a discussion with the CEO or Chief Merchant, in order to understand what the logic is for Categories 7/10/11. In a separate analysis, I observed that sales of new items in Categories 7/10 are down about 35% over the past three years ... whereas sales of new items in Category 11 are actually growing year-over-year. There are always subtleties in this work. Dig in and figure out what is going on.

Interested in having me run a Category Development Project for you? Project pricing and file layouts can be found here.


February 08, 2023

Gross Margins Matter

In a perfect world, the Categories possessing the largest share of annual sales would also be the Categories with the largest gross margin percentages ... that way, you maximize profitability.

Is that the case with this brand?


Remember, Category 11 is the Sun in the Category Solar System ... Categories 6/7 are Major Planets ... Category 10 seems to act like a large Comet.

What do gross margin percentages look like for each of the four Categories we've mentioned thus far?

  • 51.7% for Category 6.
  • 49.0% for Category 7.
  • 19.4% for Category 10 (oh ... my ... goodness).
  • 40.6% for Category 11.
#ohboy

This, ladies and gentlemen, is why we perform a Category Development project. 

Look at Category 10. Remember, this Category possesses 61.5% of sales of customers who buy from it. Those sales generate a 19.4% gross margin. That's not acceptable!! That's how we sub-optimize profit. In this case, this category represents "branded merchandise" ... this company buys products from vendors and resells them at a price largely determined by the vendor.

Category 11 is "the Sun" within the Category Solar System. But gross margins are just 40.6%, well below what we see in Category 6 (51.7%) and Category 7 (49.0%).

If you were running an email marketing program, which category "should" you feature in your campaigns? Yeah, tough question. Your response/conversion metrics will likely look good featuring Category 11. Profit will likely look good featuring Categories 6/7.

This stuff is SO MUCH FUN to dig into, don't you think?


February 07, 2023

More On Those Interesting Category Development Metrics

Here's our table from yesterday.


Let's look at the "Spent on Category" column. This metric represents the share of total spend last year spent within the category. If you look at Category 1, customers who bought from Category 1 spent just 4.5% of their total dollars in Category 1 ... meaning those customers spent 95.5% of their dollars on other categories. This Category is a "try and buy" category ... it does not own the customers it possesses.

Remember Categories 6/7/11? Those categories dominate this brand.

  • Category 6 = 34.2% of dollars spent by Category 6 customers are within Category 6.
  • Category 7 = 36.3% of dollars spent by Category 7 customers are within Category 7.
  • Category 11 = 61.4% of dollars spent by Category 11 customers are within Category 11.

This tells me that even Category 6/7 customers aren't terribly loyal to those categories ... they're gonna spend their money elsewhere (hint - Category 11).

Do you see an outlier when evaluating this column/metric?

Look at Category 10.

Turns out this is the fourth largest Category (generating $8.2 million last year) ... and customers who buy from this Category spent 61.5% of their dollars last year in Category 10. This means that Category 10 buyers are reasonably loyal to Category 10.

It kind of seems like Category 10 is like a comet ... maybe it isn't part of the formal solar system with Category 11 as the Sun and Categories 6/7 as major planets. We'll see.


February 06, 2023

Interesting Category Metrics

Here's our Category lineup from yesterday.

Categories 6/7/11 dominate this brand, with Category 11 consuming more than half of all sales. This Category is the "Sun" in the Category Solar System, isn't it?

Among the "Big 3", only Category 11 grew in the past year ... both 6/7 contracted. That's not a good sign. In fact, nearly every category contracted in the past year.

Ok, let's look at a handful of interesting and unique metrics.


"Oth Mrch Gain" tells us how much customers who bought from the category also purchased across all other categories in the past year. We care deeply about categories 6/7/11.

  • Category 6 contracted by 5.3%. However, customers buying from Category 6 spent 8.8% more last year on all other Categories. Customers were a success, the Category was not a success.
  • Category 7 contracted by 9.9% last year. However, customers buying from Category 7 spent 9.6% more on all other categories last year. Customers were a success, the Category was not a success.
  • Category 11 GREW by 11.9% last year. However, customers buying from Category 11 spent 4.5% LESS on all other categories last year.
This tells us that it is very likely that Category 11 cannibalized other categories, taking market share from other categories. 

We'll deal with the rest of the table tomorrow.

But for today, think about your business. Do you have any Categories that grew in the past year at the expense of other Categories? Is it a good thing if a Category grows at the expense of other Categories?

February 05, 2023

Category Development - One Category Growing Quickly

Ok, here's the first table I look at when evaluating categories and customers. This table is easy to produce, you probably already look at it, but it almost always tells a story. The table below shows five years of sales history by category, rank-ordered from the best-selling category to marginal categories. Ready?


Category 11 is the category to look at, isn't it? Sales have grown from $39.5 million four years ago to $59.6 million in the past year. This category grew by 12% in the past year, by 28% vs. the average of the four years prior.

Category 11 is a monster of a category, and it is clear that Management is allocating resources to that category. Or, the customer is choosing that category, right? It's hard to de-tangle the situation.

Regardless, Category 11 is going to be a key focus of our analysis. Of the remaining 11 categories, just one (1) showed sales growth (Category 2). Every other category posted a sales decline in the past year.

This stuff is so much fun to dig into!

P.S.: Interest in Category Development projects is on the rise - get in now before I get too busy (click here).


Propose to Your Future Spouse at Cracker Barrel

Seven years ago I presented a series of Powerpoint Slides about marketing ideas ... and my goodness, were those slides HATED by the audience! Hated! "We're never going to drive a Wiener Mobile across America, Kevin. Never. Bad idea. What else do you have?" 

Those audiences would really hate this idea (click here).

P.S.: I realize that, as marketers that you hate this stuff ... you'd prefer to create a square digital ad with imagery representative of your brand and text that says "Great Offers, Save Now!" You think this idea is stupid. Ok. Then conceive what a "smart" version of this would look like.

February 02, 2023

Category Development and Gross Margin Dollars

Here's one that comes up all the time.

A brand has a category with an average price point of $30 and an average cost of goods sold of $14. Gross Margin = (30-14)/30 = 53%. Gross Margin per Unit = $16.

Meanwhile, another category has an average price point of $40 and an average cost of goods sold of $22. Gross Margin = (40-22)/40 = 45%. Gross Margin per Unit = $18.

Which item should be sold if you can only sell one item?

There isn't a good answer to this question. One item has a high margin but a lower price point. The other item has a lower margin but a higher price point, yielding more gross margin dollars.

Do the work here.

Does one category feed the other? In other words, does the high margin category push customers to the low margin category? That could be ok if AOVs are similar. If AOVs are lower in the low margin category, then you are creating problems.

Anytime you switch a customer from a high margin category to a low margin category, you have to increase the amount of spend to compensate for the switch. Analyze the heck out of these dynamics, then push customers to high margin / high spend categories (or items) where possible.

Next week, we'll begin to explore Category Dynamics in even more detail, reviewing the reports I look at. We're going to see that some categories are "feeder" categories, while other categories are the center of your solar system. Once we learn how all of your categories work together, we can come up with a coherent marketing plan to support increased profitability.


February 01, 2023

Different Channels, Different Selling Styles

Take your Top-100 best sellers from last week, and then measure where each item ranks among your most important marketing channels. This analysis tells you what the future holds ... items selling well at your Call Center are gonna have problems in the future, for instance.

Here were results from one company, for one good-selling item.

  • Item = 12th best selling for the week 10/9 - 10/15.
  • Call Center = 12th best selling item.
  • Online = 23rd best selling item.
  • Email = 567th best selling item.
  • Search = 20th best selling item.
  • PLA = 658th best selling item.
Meanwhile, here's the results for another good-selling item.
  • Item = 13th best selling item for the week 10/9 - 10/15.
  • Call Center = 40th best selling item.
  • Online = 8th best selling item.
  • Email = 83rd best selling item.
  • Search = 18th best selling item.
  • PLA = 33rd best selling item.
One final good-selling item.
  • Item = 84th best selling item for the week 10/0 - 10/15.
  • Call Center = 915th best selling item.
  • Online = 121st best selling item.
  • Email = 5th best selling item.
  • Search = 149th best selling item.
  • PLA = 110th best selling item.
The first item is a good seller across all channels, but is ignored by the email marketing team. Work with your email marketing team to see if the item can be featured more often, given how well the item sells.

The second item skews online, but isn't as good a seller via the Call Center. This item represents more of the future of the brand, given the Call Center vs. Online mix with this item.

The third item is being almost entirely driven by email. In my projects, it is common for items to sell well in email marketing but not as well elsewhere, frequently due to pricing promotions. However, there is an old adage that "you sell what you feature" ... and items featured in email are likely to sell better.

The future of your brand (i.e. the types of products you are going to sell in the future) is told via this analysis. Perform the analysis and see what it tells you.

What Is An "Action Stream"?

You'll hear me talking about "Action Streams" in the next few weeks, and for good reason. What is an "Action Stream"...