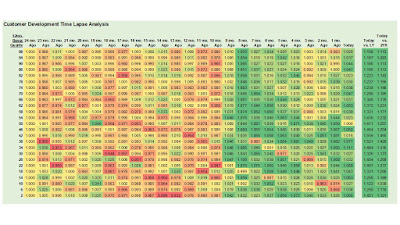
There are several key components of a Time Lapse Analysis.
First, I tackle the concept of "weighting". I create a regression model that weights historical dollars in terms of how much historical dollars contribute to future spend. For instance, a purchase in the past month might count for a weight of 1.000 ... a purchase twelve months ago might count toward a weight of 0.50. The purchase 12 months ago is half as important as a purchase yesterday.
Here's an example. Say we have a customer who spent $100 one month ago, $100 six months ago, and $100 twenty-four months ago. Say that the weights are 1.00 for one month ago, 0.65 for six months ago, and 0.30 for twenty-four months ago. Weighted spend is 100*1.00 + 100*0.65 + 100*0.30 = $195.
I sum weighted spend for every twelve-month customer.
Then I create twenty-five "tiles" ... four percentile groups of customers, based on weighted historical spend.
I count how many twelve-month buyers reside in each of the twenty-five "tiles".
I then replicate this analysis twenty-four more times, going back in time on a monthly basis.
Say I have 10,000 customers in the top 4%-tile as of today. Say I had 9,800 customers in that tile a month ago. My index becomes 10,000 / 9,800 = 1.02.
Any index > 1.00 is progressively greener in the image above.
Any index < 1.00 is progressively more red in the image above.
More on the Time Lapse Analysis tomorrow.


No comments:
Post a Comment
Note: Only a member of this blog may post a comment.