January 31, 2022

I Know, You Think Your CFO Is A Bean Counter

Somebody wants to hire me. We have an introductory Zoom, and the individual talks about the fact that they don't have resources to perform the customer acquisition work they want to perform. At some point, the Professional says ... "My CFO is a bean counter. She doesn't operate in the real world."

Maybe she doesn't operate in the real world, but she operates in a world of cash flow and profit and shareholder/owner value.

Y'all know how a profit and loss statement works, correct? Allow me to give you a brief example:
  • Gross Sales / Demand = $50,000,000.
  • Return Rate = 15%.
  • Net Sales = $50,000,000 * (1 - 0.15) = $42,500,000.
  • Gross Margin = 50%, or $42,500,000 * 0.50 = $21,250,000.
  • Pick/Pack/Ship Expenses = 10% of Gross Sales, or $50,000,000 * 0.10 = $5,000,000.
  • Contribution Prior to Ad Cost = $21,250,000 - $5,000,000 = $16,250,000.
  • Ad Cost (what you spend on marketing) = 20% of Gross Sales, or $10,000,000.
  • Fixed Costs (your salary, costs to run business that don't change as sales increase/decrease) = $5,000,000.
  • Earnings Before Taxes = $21,250,000 - $5,000,000 - $10,000,000 - $5,000,000 = $1,250,000.

Ok, I know you are bored.

Let's focus on a couple of key metrics. I calculate something called the "Profit Factor". Simply defined, it is Contribution Prior to Ad Cost divided by Gross Sales (what some call "Demand").
  • In our cases, this is $16,250,000 / $50,000,000 = 32.5%.

Why do I care about the "Profit Factor"?

Because your CFO cares about the "Profit Factor".

A complicated profit and loss statement can be reduced to this simple equation:
  • Earnings Before Taxes = (Gross Sales or Demand) * (Profit Factor) - Ad Cost - Fixed Costs.
  • $50,000,000 * 0.325 - $10,000,000 - $5,000,000 = $1,250,000.

Now, if your ad costs are generally constant and your fixed costs are generally constant, then your Profit Factor is the lever that gets manipulated.

Your CFO is sitting in her office, spreadsheet on her laptop. She's already decided that somebody in merchandising needs to improve gross margins, because she adjusted her Profit Factor from 32.5% to 35% and learned the following:
  • $50,000,000 * 0.35 - $10,000,000 - $5,000,000 = $2,500,000.

Did you see what happened there? Your CFO figured out that if the profit factor can increase buy just 2.5 points, Earnings Before Taxes double.  They DOUBLE!!

Your CFO goes back to the merchandising team, and the merchandising team tells the CFO that margins can't increase because they either have to cheapen the product or raise prices and they're already raising prices because the cost of goods is increasing. The merchandising team tells the CFO that the profit factor isn't going to change.

This is where your CFO starts counting beans. If the profit factor doesn't change, then there are only two pieces left in this equation. The CFO can look at fixed costs ... which are FIXED and do not change ... or the CFO can look at that $10,000,000 lump of ad cost and openly wonder what might happen if that $10,000,000 number was $8,750,000?

Either way, the CFO is counting beans, trying to improve profit from $1,250,000 to $2,500,000.

The CFO knows that your advertising budget is inefficient ... in other words, she knows that if you cut $1,000,000 you don't lose sales at a proportional rate.

Tomorrow I'll spend time explaining how a former marketing director turned the tables on the CFO.

January 30, 2022

Peloton

You probably saw this eleven days ago (click here).

There are two things that are hard to forecast.

  1. When the COVID-bump ends for your brand (it ended for most brands over the past year).
  2. When the growth of your brand will naturally end because you saturate your market (i.e. everybody who was going to buy a Peloton buys a Peloton, leaving you with few customers to target).
You are always ... ALWAYS ... better off not having enough product for your customers. If you think you could sell 100 widgets, plan to sell 85 widgets. You will train the customer to buy a widget before widgets run out, and you won't be left with 12 widgets when you only sell 88 of them ... you'll sell 85 and the public perceives you are running short of merch because of high demand.

You always want the public to perceive you are sold out than for the public to perceive that you need to discount because you can't sell what you have.

January 27, 2022

Just Spend More, Then!

Well, maybe.

Here is our base case.


Let's assume that we'll spend 20% more next year ... even though we proved in our last post that we are already overspending on marketing, harming profitability (in the short-term).

There goes profit ... plunging down to $9.5 million from $11.7 million. You don't make it up through five years, either. But for one year, sales increase, and you get an additional $1,000,000 to $3,000,000 in sales in future years.

Again, the business is just trapped, isn't it?

What happens if you spend 20% more for each of five years?


Now the top-line is growing annually ... it's no longer stuck ... but profit is in the toilet, costing you eight million in profit over five years.

You can't get out of the rut via tepid increases in advertising spend.

You'll need better merchandise.

And you'll need a low-cost / no-cost customer acquisition strategy.

This is why I continually harp on these concepts. When you run simulations for a brand that is already spending too much money on marketing (i.e. ad-to-sales > 20%), you know the truth. 


January 26, 2022

The Most Common Business Trajectory I Deal With

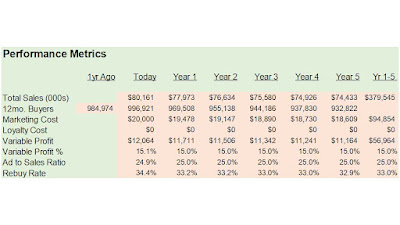
Here's a classic situation. Look at the five year projected trajectory for this brand.

In a post lockdown world, new customers stabilized and the business is projected to slowly degrade. With an ad-to-sales ratio of 25%, this company really cannot afford to spend more on marketing to grow.

Why do I say that?

Let's pretend that the business cuts back on their marketing spend by 20% for just one year. Here is how the trajectory changes.


You cut back for one year ... just one year ... and the top-line crumbles and it does not quite return to prior levels even when you restore ad spend to prior levels.

Here are top-line sales for five years plus the year just completed.

  • Base Case (Millions):  $80.2, $78.0, $76.6, $75.6, $74.9, $74.3.
  • Reduced Ad Spend:    $80.2, $71.2, $74.0, $73.5, $73.6, $73.4.
Now let's look at profit:

  • Base Case (Millions):  $12.1, $11.7, $11.5, $11.3, $11.2, $11.2.
  • Reduced Ad Spend:    $12.1, $13.4, $11.1, $11.0, $11.0, $11.0.

You generate an additional $1.7 million profit by cutting back on ad spend for one year ... but ... BUT ... you lose file momentum, causing you to $1.1 million of profit in the next four years.

This is the situation I run into all the time. The business is stuck. Completely stuck. If it wants to be more profitable it can be more profitable ... for a period of time ... then profit erodes because you lose file power. However, to generate additional profit you hurt top-line sales, and you hurt top-line sales for subsequent years even if you restore ad-spend to prior levels.

This is what happens when you depend upon marketing to generate orders. Eventually you trap yourself. You can't spend more because it is unprofitable. You can't spend less because the business suffers. You're stuck.


January 25, 2022

Overspending

If you spend more on marketing, you'll likely lose profit in the short-term but you'll increase the top-line both short-term and long-term.

Sometimes, however, your company grossly overspends on marketing. This creates a different set of dynamics. Let's say that I cut back my offline marketing spend by 60% ... a whopping 60%!!


Oh oh.

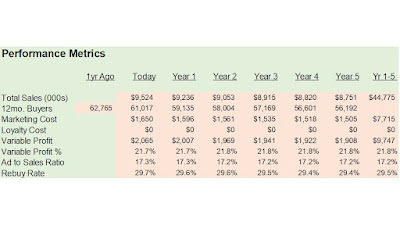
By year five, you take a business that generated $8,751,000 in sales and $1,908,000 in variable profit ... and you turn it into a business that generates $6,994,000 in sales and $2,039,000 in variable profit.

Over five years, you generate $1,106,000 more in total variable profit by cutting way back on offline marketing spend.

But your business becomes significantly smaller.

These are the traps you face, leading your business.

Run the scenarios.

Know where your business is headed.


January 24, 2022

Incremental Gain

So you'll spend $300,000 next year on digital marketing, and you want to see what would happen if you spent $400,000 next year ... you run your simulation.


You generate $199,000 in sales in the first year, then you experience diminishing returns as most of those customers do no repurchase thereafter.

You lost $40,000 spending additional money on digital marketing - after that, you generate more profit per year for four years. In total, however, your decision cost you $6,000 profit after five years.

If you extend the payback window beyond year five? Yeah, you're going to come out ahead.

I'm getting a lot of messages from you ... "it is now too expensive to acquire customers, we have to cut back".

If you cut back your marketing spend, you'll likely be more profitable in the short-term. Long-term? Run the simulation and find out. Regardless, we need to introduce this short-term / long-term tradeoff analysis to the work we perform, correct?


January 23, 2022

It's Time ... Again!

It is time for yet another run of The MineThatData Elite Program. Yeah! Four months pass quickly these days, don't they?

For just $1,800 (first-time participants, $1,000 for returning professionals) you'll get a high-level summary of your file health ... and in this run, we'll provide some focus on whether low-price customers are willing to pay higher prices during this inflationary period.

All practically for free!

Send me an email (kevinh@minethatdata.com) and we'll get started.

  • Data due by February 15, 2022.
  • Five Years of Data Through 1/31/2022.
  • Payment due by 2/15/2022.
  • Writeup delivered by 2/28/2022.

January 19, 2022

Opens, Clicks, Conversions. Wait, What?

When people talk about email marketing, you get an "industry" view of the craft. A style of language has been crafted so that professionals are speaking via common terms that everybody can understand.

This means you measure results via opens/clicks/conversions.

What would happen if you stopped your email marketing program altogether?

What would happen if you didn't execute your email marketing program for five years?

Well, when you have a simulation tool, you can answer that question.

Here is our base case for the brand we studied this week.


Aaaaand .... here's what the five year forecast looks like if we stopped email marketing altogether.


Holy cow!

Here's what sales look like by year with email marketing (000s).

  • $9,524 today.
  • $9,236 after 1 year.
  • $9,053 after 2 years.
  • $8,915 after 3 years.
  • $8,820 after 4 years.
  • $8,751 after 5 years.
Here's what sales look like without email marketing. Tell me what you observe.

  • $9,524 today.
  • $7,566 after 1 year.
  • $7,028 after 2 years.
  • $6,643 after 3 years.
  • $6,417 after 4 years.
  • $6,253 after 5 years.
Yes, the impact compounds. When you remove an email order, you remove future orders in other marketing channels. You weaken the customer, and consequently you weaken file power, hurting future sales.

Let's look at profit by year. With email marketing.
  • $2,065 today.
  • $2,007 after 1 year.
  • $1,969 after 2 years.
  • $1,941 after 3 years.
  • $1,922 after 4 years.
  • $1,908 after 5 years.

What happens if we remove email marketing?

  • $2,065 today.
  • $1,487 after 1 year.
  • $1,398 after 2 years.
  • $1,338 after 3 years.
  • $1,302 after 4 years.
  • $1,275 after 5 years.

Oh my goodness.

By the time five years have passed without email marketing, variable profit is down 34%. After you subtract fixed costs (about a million a year), you barely have any profit left!

What happened to rebuy rates? After five years:

  • With Email Marketing = 29.4%.
  • Without Email Marketing = 21.3%.
So yeah, email marketing is kinda important, don't you think?

When somebody at your company sleeps through your 2022 email marketing program, WAKE 'EM UP! Show them the results of your simulation applications, and show them that without you your company is gonna struggle. Ask them to pay attention! You matter.


January 18, 2022

Here's What Happens When Marketing Dollars Are Eliminated

Remember the stuck, tepid business we were studying?


In this scenario, I simulate what happens if we remove all offline marketing tactics.

There goes the top-line. Profit briefly improves, then, weeeeeee profit erodes quickly.

Marketing is important. If somebody doesn't think marketing is important, shut marketing down for a bit and see what happens.


January 17, 2022

Marketing's Impact on a Business

Let's dig into my advertising simulation spreadsheet. This business, like so many, is stuck.

Over the next five years this business will trend down from $9.5 million to $8.8 million. Variable profit (profit prior to subtracting fixed costs) goes from $2.1 million to $1.9 million.

No bueno.

This company advertises via print, email, and assorted digital channels.

Let's say that somebody wants to double the digital marketing budget for a year. 

Let's compare sales by year. Here's the base case:

  • $9.5 million today.
  • $9.2 million after year one.
  • $9.1 million after year two.
  • $8.9 million after year three.
  • $8.8 million after year four.
  • $8.8 million after year five.
And after doubling digital marketing dollars in year one:

  • $9.5 million today.
  • $9.8 million after year one.
  • $9.2 million after year two.
  • $9.0 million after year three.
  • $8.9 million after year four.
  • $8.8 million after year five.

Here's the base case for profit.

  • $2.1 million today.
  • $2.0 million after year one.
  • $2.0 million after year two.
  • $1.9 million after year three.
  • $1.9 million after year four.
  • $1.9 million after year five.
And after doubling digital marketing dollars in year one:

  • $2.1 million today.
  • $1.9 million after year one.
  • $2.0 million after year two.
  • $2.0 million after year three.
  • $1.9 million after year four.
  • $1.9 million after year five.

As you can see, not a lot changes. This business isn't being saved by marketing, if marketing tactics continue to be employed the same way - with just more expenditures.

Now let's see what happens if we double our digital marketing budget for each of the next five years.

After five years this business is marginally bigger ($9.7 million) and profit is lower ($1.85 million).

This business doesn't respond well to digital marketing tactics (this is frequently the case when you have a customer base age 65+).

Tomorrow I'll show you what happens if you stop offline marketing efforts with this business.


January 16, 2022

The Real Problem

Here's our business, floundering around, barely staying afloat.


The one thing a marketer actually controls is customer acquisition spend / customer acquisition programs. Yeah, I know, your CFO won't let you spend money, but you don't have to spend money to acquire customers. There are countless low-cost / no-cost programs, and the smartest companies run them routinely, constantly outrunning those who spend a fortune.

To get the business to $29.9 million in five years, we'll need a whopping 75% increase in new customers and we'll need to hold steady at that level for five full years.


We now have three scenarios to consider.

  1. Loyalty programs, which did nothing to solve the problem.
  2. Improve retention among existing buyers by 15%.
  3. Increase customer acquisition by 75%.

Almost every marketer you know would pick (2) ... a solution that is nearly impossible to achieve.

Smarter marketers would pick (3) ... a solution that is likely too expensive to implement.

But that's our job. We have to show tradeoffs.

The real problem with this business is customer acquisition. You hate hearing that. But that's the core problem. That's the problem we need to solve. We're not going to be able to sustain increases in rebuy rates of 15% every year for the next five years ... it's just not going to happen. Go look at your own metrics for proof.

January 13, 2022

Why Not Cater To All Active Customers?

Yesterday we looked at a business that was stuck.


Then we tried to improve loyalty among the best customers. The long-term problem was not solved.


So now the retention advocate might argue that we can get "all" twelve-month buyers to be more responsive. Sure! Though I'd ask a simple question ... "if you could do that, wouldn't you have already done that?"

That's the problem with retention/loyalty experts. If they had solutions, they'd have already implemented the solutions. It's terribly hard to move the needle.

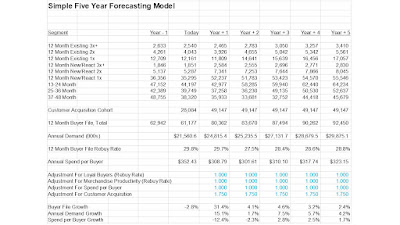
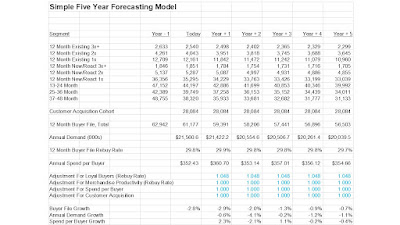
So let's assume we can increase rebuy rates by 3% ... moving the rate from about 29.8% to 30.6%. That's really hard to do, by the way.

What happens to the health of the file over the next five years?


The business is still stuck, isn't it?

We haven't solved the problem.

What does it take to "unstick" the business? How about a 15% increase in rebuy rates?


Alright! The business is "unstuck". You have a 60% increase in loyal buyers after five years. Rebuy rates went from 29.8% to 34.2%, and actually creep up to 35.6% as the top of the customer file is ultimately replenished. Sales go from $21.6 million to $29.4 million.

So yes, you can cater to all active customers, and you "can" fix the trajectory of your brand.

One problem.

If you could do this, you'd have already done it. Nothing is stopping you from improving retention, except possibly the amount you spend on marketing to your existing twelve-month buyer file.

We'll finish this topic on Monday.


January 12, 2022

Managing A Customer File

Every one of you works for a company that has a customer file. As a consequence, every one of you plays a role in building and growing your customer file. 

Think of your customer file as an investment that pays you back interest and/or dividends over time. It's like a stock. Apple if you do things well. Sears if you mess up. Your customer file is a reflection of your marketing strategy interacting with your product strategy.

Loyalty experts demand that you focus on your best customers - that you reward them (often by asking them to pay less for items which means you have less profit which means you can't invest as deeply in new customers which means you'll have fewer new customers tomorrow which means fewer loyal customers in the future).

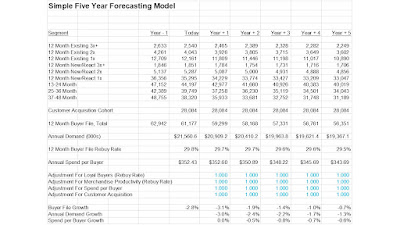
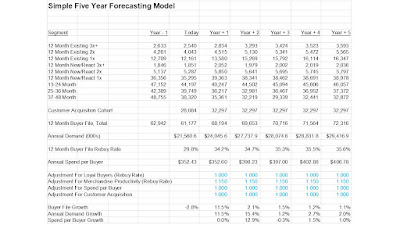
Here's a business that is kind of stuck. In the future, the business is forecast to contract.


There's a lot of data there - it isn't the easiest image to read.

The brand is forecast to decline from $21.6 million today to $19.4 million in five years. I'm confident Management finds that outcome "unacceptable".

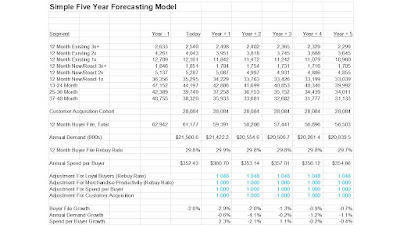
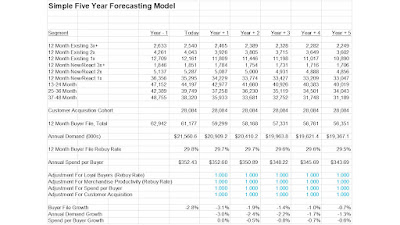
So let's look at the 12 month existing 3x+ segment ... these are customers who bought two years ago and bought 3+ times in the past year. They are the best customers. There are only 2,633 of them. They have a 74.4% rebuy rate. Let's assume that somehow, somehow, marketing can implement a loyalty program that causes 78% of these customers to purchase instead of 74.4% on an annual basis. Let's assume they do this every year for the next five years. What does the business look like?


You can see that the top-line improves ... after five years, the business is forecast to generate $20.0 million instead of $19.4 million. So five years of hard work on the very best customer segment results in a business generated $600,000 more in sales. How much money did you have to invest to get such a paltry increase?

This is the "loyalty problem". You work so hard to cater to your loyal customers and you get so little in return. The challenge this brand faces, long-term, is not solved via loyalty programs. The business is still stuck, contracting over time, and a modest lift on top of a stuck/contracting business is not a solution to the problem.

Tomorrow we'll extend the argument a bit.


January 11, 2022

Your Metaverse Purchases

Though it did look like the customer was completely lost within the metaverse in the final three seconds of this wonderful shopping session which included a milk check where the user grants Walmart digital access within the home, a large screen TV purchase, cheap wine, and an oil change.

Here's the video.

We'll see if this version that comes true.


January 10, 2022

Going Against The Odds

On Sunday Night Football, the Los Angeles Chargers trailed 17-14 in the third quarter when they faced 4th and 1 at their own 16 yard line.

In the history of Professional Football, it is unlikely that anybody in the 3rd quarter has EVER gone for it in this situation.

The Los Angeles Chargers went for it.

They failed to convert.

The Las Vegas Raiders kicked a field goal 4 plays later ... three free points for the Raiders in a game that ultimately went to overtime.

Twitter, predictably, exploded ... 'HOW STUPID IS THE COACH OF THE CHARGERS??'

There's a bot on Twitter that calculates the odds of a team winning by going for it vs. punting in that situation. The bot said that the odds of winning were GREATER by going for it vs. not going for it (in a situation where not one coach likely ever went for it in the history of the NFL).

Twitter, predictably, would respond 'I DON'T CARE, THAT'S A STUPID DECISION'.

When you have data that goes against mainstream decision-making, you're going to have a hard time convincing anybody to make a decision that goes against mainstream decision-making.

Now think about the thesis that customer acquisition programs are more important than loyalty programs. All the data in the world tells you the latter is more important. Simulation data tells you the opposite. The information available to us changes, and we likely change (over time) as a consequence.


P.S.: Yesterday's post (click here) asked you an investment question. Here are the results (click here). I will address my answer to this question next week.


January 09, 2022

Quick Quiz

You can acquire a customer and lose $24 profit acquiring the customer (total profit / total customers acquired).

In Year One, you generate $19 profit from this customer.

In Year Two, you generate $9 profit from this customer.

In Year Three, you generate $5 profit from this customer.

Should you acquire this customer?


Email me (kevinh@minethatdata) with the reasons for your vote.

January 05, 2022

Getting Loyalty to Work

Annual Repurchase Rates are highly correlated with Annual Purchases per Reactivated Buyer.

In other words, if your twelve-month buyer file has a 30% rebuy rate, those who do repurchase are likely to purchase maybe 1.7 times per year.

If your twelve-month buyer file has a 75% rebuy rate, those who do repurchase are likely to purchase maybe 6.0 times per year.

This is where loyalty efforts should be studied.

Let's say that the goal of a loyalty program is to get customers to purchase 10% more times per year.
  • 30% Rebuy Rate:  1.7 purchases per year * 0.10 = 0.17 additional purchases. Multiplied by a 30% rebuy rate = 0.05 additional purchases.
  • 75% Rebuy Rate:  6.0 purchases per year * 0.10 = 0.60 additional purchases. Multiplied by a 75% rebuy rate = 0.45 additional purchases.
You'd barely notice 30% of customers buying 0.17 additional times per year ... it's 0.05 additional purchases per twelve-month buyer.

You're more likely to notice 75% of customers buying 0.60 additional times per year ... it's 0.45 additional purchases per twelve-month buyer.

See how the math worked?

That's the thing about loyalty programs ... you must manage a high-rebuy customer base purchasing a half-dozen or more times per year before your CFO will ever notice what you've accomplished.


P.S.:  This is where somebody will email me and say "Do better, Kevin. You can do the customer acquisition work and you can do loyalty work." Sure - you can do the loyalty work. But the loyalty work simply won't matter. When you run the simulations, you learn that the customer file doesn't fundamentally change. This is the thing that retention/loyalty marketers fail to understand ... they've never run the simulations so they don't see that all of that hard work yields short-term profit (which is good) but doesn't change the trajectory of the brand one bit. I've run the simulations, and I'm trying to help you at no cost to you whatsoever.

January 04, 2022

Jimmy Johns and Spotify

Yesterday I mentioned the concept of "Loyalty Communication". 

Loyalty Communication is different than a Loyalty Program. This isn't about telling a customer they get 40% off today only (and then next week they again get 40% off today only), and it's not about telling the customer that today is "triple points day".

Instead, you are communicating to the customer what the customer did. It's about the customer.

Like Jimmy Johns telling you what your year looked like eating their subs.


Or Spotify telling you what your year looked like.


By the way, I'd have never guessed this, but my most listened to song of 2021 was the 2020 pop hit "Supalonely". Go figure. And I never would have guessed my day to order subs was for lunch on Wednesday.

Do some things for customers who are caught between a first purchase and loyal status. You can spend minimal money and yet be creative about how you make the customer experience about the customer.

January 03, 2022

You Want A Kevin-Approved Omnichannel Marketing Strategy? Ok!

You've seen the Progressive Commercials with Dr. Rick, the parenta-life coach.


In fact, Progressive created a whole world for him. Mini-documentaries, thirty-second helpful hints, and they even wrote a book for him that you can download for free on Amazon, titled "Dr. Rick Will See You Now".

Try something creative. Yeah, I know, the odds of it working are not great. But instead of arguing about costs going up on Facebook and Google, why not argue about doing something unique and different?


P.S.: This is the point in the discussion where a reader emails me and says "Great content, but this time I disagree with you, I'm a State Farm customer and nothing Progressive does will cause me to change. And it isn't in good taste to make fun of a 35 year old who admires well-crafted sandwich slices in the deli section of a store while shopping for a tailgate party at a football game. Wasted marketing dollars. But you go on preaching." I hear you. I'm just asking you to re-introduce the creative team to the direction your brand is heading in. The creative team has been optimized out of the business over the past 15 years. It's time to re-introduce them to your core business.

January 02, 2022

Your Focus

Let's assume you retain 33% of last year's customer base. If you retain the customer, the customer spends $200. Let's assume you have 100,000 twelve-month buyers.

Let's assume that each new customer spends $120 in the year of acquisition. Let's assume you generate 70,000 new/reactivated buyers a year.

Let's assume your CEO somehow commands you to increase retention rates by 20% ... meaning that your 33% rebuy rate becomes a 39.6% rebuy rate.

  • 12-Month Buyers = 39.6% Rebuy Rate * $200 per Repurchaser * 100,000 Customers = $7,920,000.
  • New/Reactivated Buyers = 70,000 * $120 = $8,400,000.
  • Total Sales = $7,920,000 + $8,400,000 = $16,320,000.
  • Total Customers = 39,600 + 70,000 = 109,600.
Now, let's assume your CEO instead commands you to increase new/reactivated customer counts by 20%.

  • 12-Month Buyers = 33% Rebuy Rate * $200 per Repurchaser * 100,000 Customers = $6,600,000.
  • New/Reactivated Buyers = 70,000*1.2 * $120 = $10,080,000.
  • Total Sales = $7,920,000 + $8,400,000 = $16,680,000.
  • Total Customers = 33,000 + 84,000 = 117,000.
Which business would you rather manage heading into the following year?
  • $16,320,000 annual sales and 109,600 twelve-month buyers?
  • $16,680,000 annual sales and 117,000 twelve-month buyers?
We'd all pick the latter, every one of us.

And yet, we constantly chase the former.

Our focus today determines how successful we'll be tomorrow. Let's focus on what matters.

What Is An "Action Stream"?

You'll hear me talking about "Action Streams" in the next few weeks, and for good reason. What is an "Action Stream"...