December 08, 2022

Price is Not the Entire Story Here

We studied one category yesterday. Here is the relationship between change in price and change in total margin dollars, by category. Tell me what you observe?


This is very interesting.

Where does the curve peak? Right around a change in price of 1.3.

In other words, margin dollars were maximized at around a 30% increase in price.

Whaaaaaaa?

Now look at the y-axis. Margin dollars peak at a 30% increase in price, however, margin dollars peak at about 0.92 ... an 8% margin dollar decrease vs. last year.

What does this mean?

It means that something else is going on that caused the business to fall apart. In this case, I know the answer ... this brand cut WAY BACK on marketing dollars targeting customer acquisition prospects. By cutting back on marketing spend, the business had no way to achieve optimal gross margin dollars (though the business might achieve optimal profit dollars).

But the price increases aren't, for the most part, limiting gross margin effectiveness.


December 07, 2022

Prices Going Up

Here's one of the things I keep seeing in 2021-2022. Look at annual sales for this one specific category.

  • $2.1 million in past year.
  • $2.5 million a year ago.
  • $3.0 million two years ago.
  • $2.7 million three years ago.
So, yeah, you can see the COVID-bump from two years ago. But in the past year sales declined by more than 10%. That's probably not COVID-bump related.

Here are price per item purchased metrics for the past four years.
  • $31.53 in the past year.
  • $24.94 a year ago.
  • $22.79 two years ago.
  • $22.40 three years ago.
Well, prices are up ... way ... way ... up.

Let's look at gross margin percentage.
  • 53.8% in the past year.
  • 49.6% a year ago.
  • 48.1% two years ago.
  • 48.9% three years ago.
Those figures make it look like prices were increased faster than cost of goods increased.

Let's look at sales from items selling at/above their historical average price point.
  • $1.8 million in the past year.
  • $1.8 million a year ago.
  • $1.8 million two years ago.
  • $1.5 million three years ago.
So, items selling at/above their historical average price point continue to generate comparable levels of revenue. This means items selling below their historical average price point are in severe decline.
  • $0.3 million in the past year.
  • $0.7 million a year ago.
  • $1.2 million two years ago.
  • $1.2 million three years ago.
This may not be an issue of raising prices ... instead, it looks like an issue of not discounting anymore. By not discounting, the brand "appears" to have increased prices, and the perceived increase in prices results in a sales hit.

What happened to total gross margin dollars generated?
  • $1.1 million in the past year.
  • $1.2 million a year ago.
  • $1.4 million two years ago.
  • $1.3 million three years ago.
The differential in price (this year vs. last year) resulted in fewer gross margin dollars.

This is the story for one category. You need to look at all categories, of course.

December 06, 2022

Category Analysis

Our past-lockdown inflationary period has illustrated to me the importance of analyzing merchandise categories.

Thirty years ago, your direct marketing team carefully studied the performance of key items, of spreads of items (in paper catalogs), seeking to understand why marketing activities performed well (or performed poorly). Turns out that big gains (or big challenges) were seldom the responsibility of the marketing department. Instead, the business thrived or failed because of what was being sold, at the price it was being sold at.

A decade ago I took a shot at understanding the role merchandise played in the health of a business (I called this "merchandise forensics").

Today I need to revisit the topic, but come at it from a different angle. I receive so many questions about the impact of inflation on customer loyalty and customer acquisition. It is hard to measure the impact of price changes on your customer file when looking at the business as one big homogenous brand. But if you divide the business into pieces, into merchandise categories, you learn that each of these "mini-businesses" have their own dynamics. Some categories experience price increases, others do not. Some categories greatly expand new products, others focus on tried-and-true winners.

This diversity of "mini-businesses" helps us understand what is driving a business and what is holding a business back.

You undoubtedly have many merchandise categories, and if you optimize category performance, you have a diversity of behavior worthy of analysis.

So, tomorrow, we begin our study of merchandise categories. Email me if you would like your business analyzed (kevinh@minethatdata.com).

December 05, 2022

Spotify Wrapped

How hard is it for you to replicate what Spotify does with Spotify Wrapped?


I mean, you have loyal customers. Why not regale them with everything they purchased during 2022? Make it fun - classify the customers based on their behaviors (Spotify calls me a "connoisseur" ... and surprisingly, they say I listened to Ariana Grande more than any other artist, which is dumbfounding to me but has to be true).

You have the data.

You have creative staffers to help you.

Why not emulate Spotify?


December 04, 2022

Deion Sanders

If you watched football in the 90s, you knew who Deion Sanders was

If you follow college football in the 20s, you know who Deion Sanders is ... the wildly successful coach of Jackson State, and the newly appointed head coach at Colorado.

Now, watch this video ... this is his first seven minutes with his new team at Colorado (click here).

Name one person who promotes the omnichannel thesis in retail, or who promotes catalog marketing ... name one ... who has this level of passion? Name one. I'll wait for your answer.

Is he going to be successful? Who knows?

But he cares.

And nobody, and I mean nobody in our industry, has this level of passion.

We wonder why our industry is a cold, tepid place where we think we're doing good work when we pay Google/Facebook money?

If you find somebody in this industry who cares like he does, follow that person.

Longer-Term Impact of Discounting Today

Now that you have recovered from the magic, the pageantry, the thrill of Cyber Monday, you might want to take a look at how you changed your business going forward ... well, more specifically, how you altered future customer behavior.

I posted this information on LinkedIn last week ... when I post it on Twitter I get the typical professional with 22,493 tweets and 94 followers telling me I'm a moron ... but at least on LinkedIn folks understand the nuances of business. I ran a model last week, predicting future spend on full-priced items and on discounted items, based on purchase history of full price and discounted items.

Assume we have a customer who spent $100 on full-priced items in the past, and spends $100 on Cyber Monday on full priced merchandise. In the next twelve months, the customer will spend:

  • $62.50 on full-priced items.
  • $13.60 on discounted/promoted items.
  • $76.10 total spend.
  • $45.32 future gross margin dollars (59.6%).

Now let's assume that the customer who spent $100 on full-priced items in the past spends $100 on Cyber Monday on discounted/promoted items. In the next twelve months, the customer will spend:
  • $52.80 on full-priced items.
  • $20.50 on discounted/promoted items.
  • $73.30 total spend.
  • $42.02 future gross margin dollars (57.3%).

In the future, the customer bends future dollars away from full-priced items, toward discounted/promoted items. The customer generates less profit (gross margin dollars) in the future because of behavior in the past.

Your mileage will vary?

What does the data look like for a customer with $0 full-price and $200 discounted/promoted?
  • $43.10 on full-priced items.
  • $27.40 on discounted/promoted items.
  • $70.50 total spend.
  • $38.72 future gross margin dollars (54.9%).

The more you discount/promote today, the more you bend future behavior toward discounting/promotions.

Now, I get it ... there are times you have to run promotions, or want to run promotions, or you have to liquidate merchandise.

But you don't have to do what trade journalists demand of you (40% off on Cyber Monday or 50% off on Black Friday). You just don't have to follow the industry narrative.

Do what is right for your customer, and for your business.

December 01, 2022

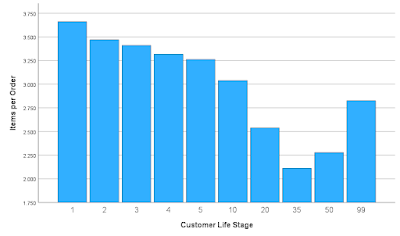
Items per Order

Take a look at this graph.


As the customer becomes more loyal, the customer (not shown here) orders more often. However ... however ... as the customer becomes more loyal and orders more often, the customer purchases fewer items per order.

Let's see what happens to price per item purchased.


Oh oh.

This is a signature of a brand that demands that best customers buy frequently. The company gives the customer incentives to purchase ... so the customer purchases more often, but backs off on how much the customer is willing to spend.

Loyalty advocates manage businesses that possess customer attributes similar to what we've observed this week. They discount like crazy to best customers, they get customers to buy more often, but customers purchase fewer items at a comparable price. Loyal customers are making tradeoffs ... all the time. You think you are doing good work. The customer adjusts.


Content Creation

Here's the link . I realize many of you are stymied by creating content for your customers. Some of you would say the video above is poi...