April 30, 2023

An Update!

In the next few weeks I will unveil a new product offering ... "Hillstrom's Marketing Budget Experiments"! You can click here for project pricing (as well as seeing project pricing for other work I perform).

As always with new product offerings, the kinks aren't always worked out ... that's why you, the intrepid blog follower, get first crack at the offering at a reduced price. You help me work out the kinks, I help you achieve an outcome at a great value! For this project, you will pay 60.3% of the project fee. Stupid inexpensive. Let me know before the end of the week if you wish to be part of the pilot and save 40% in the process.

More data and examples begin tomorrow. Elements of Category Dynamics will be folded into our experimentation framework. We are headed toward the following product.

  • Enter your monthly marketing budget by major marketing channel.
  • Supply 5 years of purchase history. This is used to forecast cohort performance, ultimately calculating CLV at a segment level.
  • My product allows us to vary marketing spend by month, seeing what the long-term impacts are of the decisions we're making today.
  • My product produces a five-year sales forecast and calculates down to variable profit / contribution.
  • We "experiment" ... seeing if there are combinations of channels, ad spend, and merchandise productivity improvements that yield the result you expect of your business over time.

Fun is coming!

April 27, 2023

The Best Categories & New Customers

For this brand, Categories 12 and 19 are the "suns" of their category ecosystem. Both categories yield high-value customers, as illustrated below. Customers buying from either category tend to reside in the top 40% of the value segments I created.


Smart companies do smart things. They focus on the categories that drive high-value customers, and within those categories they make sure that winners get proper attention and they make sure that new items are properly developed via low-cost / no-cost marketing scenarios.


April 26, 2023

Are Those December Newies All That Bad?

Well, maybe.

Remember when I mentioned that the brand we are studying acquired good customers in August and lousy customers in December? I plotted fraction of new customers from December by new customer quality. What does the image suggest to you?


Among the best newbies, 15% to 20% of 'em were acquired in December. In other words, December newies aren't uniformly "bad" ... there are plenty of fabulous new buyers acquired in December.

Meanwhile, the worst two segments (24 and 25) do not have a huge share of December newbies. In other words, December newbies aren't the "worst" ... though the percentages are very high for not-so-good segments from 19-23.

Remember when I mentioned that August newbies were "good"? Well, what does the graph below tell us?


Oh, isn't that interesting?

Turns out that August newbies are better ... until you get to percentile groups 22-25, where a ton of August newbies exist. What the heck is going on there?

Well, it turns out that there is one merchandise category that is largely offered in late summer, and that category delivers new customers who perform poorly. Take a look at Merchandise Category 15.


The customers acquired from this category perform poorly, don't they? And in a separate analysis I demonstrated that these customers were generally acquired between late June and early September ... with August being the primary month for sales for this category.

There is this bubbly interaction between what you sell, when you sell it, and how you market to customers. It's not something you can easily separate, and it's not something you come up with simple rules to deal with. You have a lot of interactions, and those interactions dictate future success.


April 25, 2023

You Want To Acquire The Good Customers, Right?

The brand we've studied this week acquires a lot of customers ... and those customers have differing levels of future twelve-month demand. Take a look ... the graph below shows 4%-tiles of customer quality on the x-axis vs. future twelve-month demand on the y-axis.


There are all sorts of good customers acquired by this brand ... the top 20% of the file delivers customers worth between $69 and $141.

The bottom 20% of the file delivers customers worth between $17 and $28.

You'd want to know which customers end up in the top twenty percent, and which new customers end up in the bottom twenty percent, correct?

All this stuff is straightforward, it gives you plenty of knowledge, and you end up protecting the future health of your business in the process. 

Get to know your new customers, ok?


April 24, 2023

Many Items or Fewer Items: The $100 Question

Yesterday I illustrated an example of a newly acquired customer in August - the customer spent $100 on three items.


The customer is valuable - worth $81.18 in the next year.

Let's experiment a bit ... instead of the customer buying three items at $33.33 each, how about we see what happens if the customer bought one item at $100.00.


This customer is worth less ... $76.96 in the next year. The difference happens within rebuy rates ... 43.9% for the customer buying three items in a first order, 41.6% for the customer buying just one item at $100. Remember - the AOV is the same, but the presence of multiple items in the order yield a customer with better future value.

In most of my projects, it is better to encourage a customer to buy more items in a first order, given a comparable AOV.


April 23, 2023

Marketing Budget Experiments: Future Value of New Customers

Category Development and Future Value meet up in a typical Marketing Budget Experiments project.

I commonly develop twelve-month future demand projections for customers with varying attributes in a first purchase. I build a Logistic Regression model to predict how likely a first-time buyer is to purchase again next year ... and I build an Ordinary Least Squares Regression model to predict how much a first-time buyer will spend in the next year if the customer repurchases. Coefficients from both models are input into a spreadsheet so I can experiment with various customer attributes.


You'll want to click on the image to see the numbers.

Essentially, I have a series of predictive inputs ... AOV on a first order, items purchased on a first order, share of demand from new items, share of demand from items selling below their historical average price point, month of first purchase are all included on the left side of the image above. The middle set of coefficients represent different merchandise categories that the customer could purchase from. The right-side set of coefficients represent different marketing channels that the customer purchased from in a first order.

So, this customer spent $100 on three items, buying only existing items at/above the historical price point of the items purchased. The order was in August, the customer bought from Category 19, and the customer bought from Marketing Channel 4 (which in this case was email marketing).
  • 43.9% chance of buying again next year.
  • $185.08 spent if the customer buys again during the next year.
  • $81.18 future demand value.
The data is only useful if we compare the customer to another customer, correct?

Let's say that the attributes are identical, but instead of the customer being acquired in August the customer is acquired in December. Does the story change?


The story changes:
  • 42.1% chance of buying again next year.
  • $153.99 spent if the customer buys again during the next year.
  • $64.90 future demand value.
Acquire a customer in August and get $81.18 in future demand value.

Acquire a comparable customer in December and get $64.90 in future demand value.

The foundation of Marketing Budget Experiments is this work ... we first need to understand how valuable different customers are. Once we understand how valuable the customers are, we can simulate five-year customer value and determine the optimal monthly marketing spend to achieve our business goals. And yes, Category Development plays a key role here ... we'll see later this week how important different Categories are to building high-value customers.


April 20, 2023

A Delightful Outcome of a Life Table Analysis

Life Tables are an integral part of any Customer Development work performed by e-commerce brands. Life Tables also reveal delightful outcomes that confound the mind.

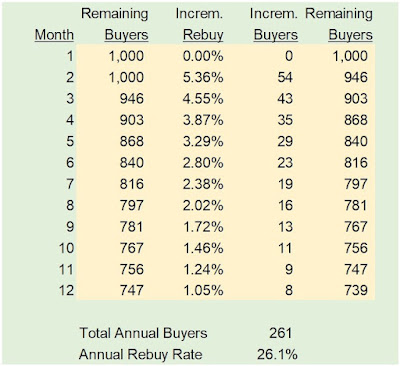
Here's a typical Life Table for a brand with existing customers that yield an approximate 31% rebuy rate on an annual basis.


You've all looked at a situation like this.

Let's run a small experiment. In the first month, let's just pretend that zero (0) of the 1,000 initial buyers repurchase.  How does the rest of the year progress, even if repurchase rates after the first month are identical to normal?


Did you see what happened?

Read across the Month = 2 row in each table ... you have 50 purchasers in the top table .. in the bottom table (where nobody purchases in Month = 1) you have 54 purchasers. You make up four buyers. In Month = 3, you make up 3 purchasers. And after a full year, the 63 initial customers who were lost are reduced to 308-261 = 47 buyers.

The same thing happens in reverse ... if business is great, you get the benefit of great business early on and then, even with constant rebuy rates, the actual number of customers buying is smaller.

I receive feedback from readers - readers typically want to know how to "improve" rebuy rates. There are two ways to do this, of course.

  • Sell better merchandise, and/or develop winning new items that become winning existing items.
  • Spend more money marketing to customers.
Both methods are valid ... but interestingly, both methods are limited by the math in the life table above.

Your rebuy rates are highly dependent upon what you sell and how often customers want/need what you sell. Under normal conditions, math conspires to hold your rebuy rates within a common band.


April 19, 2023

Parsing Through Channels - Incremental Impact of One Channel

You have a segment of customers. Based on your best guess for attribution, here's how the customer segment behaves.

  • 40% Annual Repurchase Rate.
  • Half of demand is organic - not caused by marketing.
  • 25% of demand is caused by email marketing.
  • 10% of demand is caused by social.
  • 10% of demand is caused by search.
  • 5% of demand is caused by other marketing activities.
Look at email marketing. 25% of the 40% repurchase rate (10%) is caused by email marketing. If you improve email marketing productivity by 15% by featuring better merchandise, you impact rebuy rates by 10% * 15% = 1.5% ... a 40% repurchase rate becomes a 41.5% repurchase rate.

That may not seem like much to you. But follow these assumptions.
  • Base Case Profit = 40% Rebuy Rate * $150 per Repurchaser * 40% Profit Flow-Through - $10 Customer Ad Spend per Year = $14.00 Profit.
  • New Case Profit = 41.5% Rebuy Rate * $150 per Repurchaser * 40% Profit Flow-Through - $10 Customer Ad Spend per Year = $14.90 Profit.
Multiply that out across your email subscriber base and you have something. In Marketing Budget Experiments, you get to see how this becomes compound interest over time ... which is kinda cool to be honest!

April 18, 2023

Budget Adjustment

Here's a subtlety you likely deal with.

Assume a segment of customers had 10,000 buyers last year. This year the segment has 12,000 buyers.

Let's pretend that you are holding your retargeting budget constant this year ... you are essentially spending the same amount year-over-year at a segment level. Now, I realize you are not executing retargeting at a segment level, you execute it at a budget level. But your budget-level decisions impact segment-level performance.

Pretend that the segment of customers above has a 40% annual repurchase rate. Pretend that retargeting accounts for 10% of the 40% annual repurchase rate ... 4%.

Because you are spending the same amount but have 12,000 customers instead of 10,000 customers, your repurchase impact is (10,000/12,000)*0.04 + 0.36 = 0.833*0.04 + 0.36 = 0.0332 + 0.36 = 39.3%.

Stated differently, when the customer file grows but the budget remains constant, rebuy rates decline. Not a lot (in this example) ... but something to think about.

April 17, 2023

Payback Window

When focusing on Marketing Budget Experiments, there is a tension that must be resolved.

The tension? How much time needs to pass to optimize profit? And ... when is profit optimized?

These are not easy questions to answer.

The company below spends $100,000 acquiring customers ... then the newly acquired customers pay the brand back. In the Marketing Budget Experiment below, we simulate what happens at different customer acquisition investment levels. Each row represents cumulative profit after "x" years. Click on the image - the numbers are tiny but are important.


If you want acquisition efforts to be optimized? Spend $25,000.

If you want your payback window (in this example - your mileage will vary) to be optimized after one year?  Spend $50,000.

If you want your payback window to be optimized after two years? Spend $75,000.

If you want your payback window to be optimized after five years? Spend $125,000.

If you want your payback window to be optimized after ten years? Spend $175,000.

None of the scenarios require the brand to spend what the brand is currently spending ... $100,000.

All of the scenarios give you something to think about. Everybody will have an "opinion" about what should be done, about what is "right". Not many people will agree.

Be honest with yourself. What decision would you make here? Explain your decision.

Do you have an application that performs this level of insight for you?


April 16, 2023

How Winners Impact Marketing Productivity

Ok peeps, we have our relationship.

Let's take a brief trip in the way back machine. It's 1993. I'm sitting in a conference room at Lands' End. We have all of our spreads from a catalog on the wall - each spread has a tag board color that represents how profitable the spread was. Now, we did this for all of our monthly catalogs, and over time we realized that if we populated the first twenty pages of the catalog with our absolute best sellers (called "winners"), the catalog outperformed catalogs where we dumped garbage in the first twenty pages. This fact applied in two different ways. First, you needed the best merchandise. Second, you needed the best creative. I recall one item which was re-shot with an employee instead of a model - and that item dropped in productivity by 30% while comparable items with model-centric creative performed on plan. So you needed the best products and the best creative. If you did both, the catalog "worked better", and as a result you could mail the catalog to more customers/prospects, which caused more customers which caused future catalogs to generate more sales.

Yeah ... a lotta "more" going on there.

That was 1993. It's 2023. Ask your e-commerce executive if she is featuring the best selling items with the best creative where possible? Too often, the answer is "no", and you'll get a flimsy answer in response to your question ... something about "defending the brand".

Even a five percent increase in productivity makes a difference. Here's an example.


Here a marginal five percent increase in productivity (due to featuring winning items and winning creative - not hard to do) turns a money-loser into a profitable endeavor. The incremental sales (in this case, your mileage will vary) are generated at a 54% variable operating profit (contribution) rate. Your CFO likes those situations.

Now that you are making more profit, you can spend more money to get near break-even.


You can spend an additional $4,000 ... 4% more ... because productivity is 5% better ... and you still end up making more profit.

If you work hard on Category Development, your marketing productivity improves. If your marketing productivity improves, you can spend more marketing dollars ... sales increase ... profit increases ... and you have more customers to market to next year.

Sounds like a good thing, right?

April 13, 2023

The Organic Percentage

Back to our relationship.


One of the most fascinating aspects of marketing is understanding what your Organic Percentage is.

The Organic Percentage is, of course, the percentage of customers/sales that happen if you do nothing. If you don't spend any marketing dollars in a given month, you will still get new customers.

If you are a startup, your Organic Percentage is low. Nobody knows who you are, and you have to do "something" to create awareness.

If you are Macy's, everybody knows who you are and many have forgotten you altogether! Regardless, you spent decades "building a brand" ... and that brand pays you back via new customers who shop without the aid of marketing spend. Purists would suggest that marketing dollars spent in 2006 are paying off in 2023, and they are probably right ... but you don't "know" that so you cannot attribute Organic New Customers today to marketing activities in 2006.

What happens if you don't know your Organic Percentage?

What usually happens is this ... if you are trying to figure out how much to spend in a month, you'll fit a line that is more linear in nature, causing you to think you can spend more marketing dollars monthly when in reality you simply can't do that.

Know your Organic Percentage, ok? Please, know this metric and thoroughly understand it!


April 12, 2023

The Curve

Here is our image from yesterday.


The key to any Marketing Budget Simulation (this topic is being explored and will come together as we work through our examples) is to understand the law of diminishing returns. The law is apparent in the image above. The red line depicts this relationship.
  • 900 new customers on $0 spent.
  • 2,385 new customers on $50,000 spent.
  • 3,000 new customers on $100,000 spent.
  • 3,472 new customers on $150,000 spent.
  • 3,870 new customers on $200,000 spent.
If you spend nothing, you still get 900 new customers. This is an important finding, one we'll talk about tomorrow.

If you spend $50,000, you get 2,385 - 900 = 1,485 new customers.

If you spend an additional $50,000, you get 3,000 - 2,385 = 615 new customers.

If you spend an additional $50,000, you get 3,472 - 3,000 = 472 new customers.

If you spend an additional $50,000, you get 3,870 - 3,472 = 398 new customers.

This is the law of diminishing returns. You spend more, you get less.

This law dominates marketing spend. Sometimes this relationship is absolutely punitive, sometimes it is nearly linear (suggesting that the brand could spend a lot on marketing and not be penalized).

This curve, this "law of diminishing returns" dictates everything we do. It's the reason we cannot spend a ton of money. You see the results via ROAS ... old school marketers see it via the ad-to-sales ratio (which is the inverse of ROAS). Eventually your tactics simply no longer work.

This curve, interestingly, can be used to simulate the relationship between short-term profit and long-term profit (i.e. CLV or LTV or whatever you want to call long-term value). If you know how much a customer delivers in the future and you know the relationship above, you can find the place where your business is healthiest over time.

And if you manage your categories appropriately, you lift these curves, allowing you to spend more.


April 11, 2023

A Beautiful Relationship

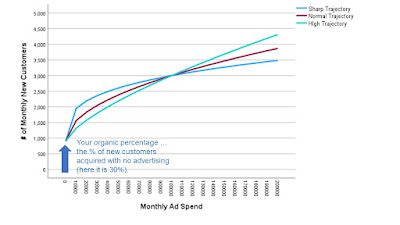
This image is going to provide the foundation for what I will talk about during the remainder of April (and possibly beyond). So yeah, it's an important image and you should click on it, print it, and post it in your virtual office or your corporate office. Here we go.


In this graph, I am depicting multiple topics simultaneously. The core relationship being shared here is one between monthly ad spend (x-axis) attributed to new customers and monthly new customers (y-axis).

The three lines depict different curves observed in my project work. Sometimes (green) you can keep spending ad dollars and keep getting new customers. Sometimes (blue) you spend and get a lot of new customers, then the well runs dry.

The arrow represents the organic percentage ... the percentage of new customers you generate if you don't perform any advertising at all.

Tomorrow we'll start diving into some of the topics associated with this image. When we think about Category Development and how it relates to what is coming, we're thinking about ways to boost the trajectory from a Sharp Trajectory (not good) to a High Trajectory (good).


April 10, 2023

Reposted From LinkedIn

Ok, here's something I posted over on LinkedIn. Send me an email with your answers, or leave a comment over there with your thoughts.


This topic came up earlier today and generally comes up every two weeks - it's a topic that is challenging for my client base to deal with effectively. 

A company generates 40% of annual new customers in the late November - mid December timeframe. An analysis of new customers illustrates the following:

Jan - October Newbies (60,000): Profit per New Customer = ($4.00). Year 1 Future Profit = $12.00. Year 2 Future Profit = $10.00. Year 3 Future Profit = $8.00. Year 4 Future Profit = $6.00. Year 5 Future Profit = $5.00. Total Five Year Future Profit = $41.00.

November 1 - December 31 Newbies (40,000): Profit per New Customer = $2.00. Year 1 Future Profit = $7.00. Year 2 Future Profit = $5.00. Year 3 Future Profit = $3.50. Year 4 Future Profit = $2.50. Year 5 Future Profit = $1.75. Total Five Year Future Profit = $19.75.

A few questions for you, the intrepid marketer.

Is it a good idea to acquire new customers in November/December (hint - the answer is yes)?

From a marketing standpoint, how should you as an e-commerce marketer treat new customers acquired in November/December? Should these customers be treated differently? If the answer is yes, explain how you would treat these customers differently?

Should you ever not acquire a customer if you can acquire the customer profitably at the point of acquisition?

Are you able to see these fundamental differences in customer behavior using ROAS reporting? If the answer is no, what do you need to be able to see these fundamental differences in customer behavior?

In this case, the brand lost money acquiring customers from January - October. How long of a payback window do you believe is acceptable to lose money acquiring a customer?

Discuss!

April 09, 2023

Investing Marketing Dollars

All sorts of things impact your marketing investment in customers ... you already know this.

But we should also talk about some of the things we don't always consider.

In Category Development work, we know that customers acquired in some categories clearly outperform customers acquired in other categories in the future.

In this example, the "good" category brings in fewer customers for the same ad cost, but delivers customers with higher rebuy rates and higher spend per repurchaser metrics.


As a consequence, when comparing acquisition profit and subsequent twelve-month profit, this brand is better off acquiring customers from the "good category" - the brand nets six (6) fewer customers at a profit (loss) per new customer that is nearly four dollars worse ... however, after acquisition the "good category" delivers customers worth $6 more in the next year.

The tradeoff is obviously worth it!

Know which categories deliver customers with good future value ... then take action upon what you learn, ok?


April 06, 2023

It's Just So Interesting!

Here is a set of Category Development metrics for a category. It's just so interesting to parse this category!


Let's just go to the bottom of the table for today. The final three rows tell us a story. We observe the percentage of annual demand that comes from three customer groups ... the top row represents customers who bought from the category the year prior ... the second row represents customers who bought the year prior but not from the category ... the third row represents new/reactivated customers.

What do you see here?

This category does not generate sales from customers buying from the category the year prior, does it? 4%? It's virtually nothing.

47% of demand last year came from customers who, the year prior, bought from the brand but not the category. This category is fueled by customers previously buying from other categories.

49% of demand last year came from new/reactivated customers. This is a category that prospects consider.

Let's pretend you work in marketing, and are responsible for managing this category. Tell me what your marketing strategy is for this category?


April 04, 2023

Just Read The Text Here

If I were writing this post back in 2006, I'd offer one thousand of the most scathing words in the English language about the image below.

But it is 2023 and I'm older and wiser. So I present the following "ad" without comment:


So What Do You Do?

I talked yesterday about how Chat GPT, the popular AI tool, offered a "trained opinion" that the value of my projects were worth between a few thousand dollars and tens of thousands of dollars (click here).

We're headed down an interesting path.

Assume you are a digital analyst ... you grew up in the era of Google Analytics. Five years from now or ten years from now when the software application (which put CRM-style analysts out of work) is tied in with AI and reports are automatically written by the app, what will you do?

Most marketing analytics are going to be automated by AI. You won't need an analyst when the AI can draw comparable conclusions. Yeah, I can hear you yelling at me already ... "we can't be replaced, we provide too much value." You replaced the prior generation ... some poor IT guy writing C++ or Easytrieve was displaced by you ... you will be displaced by what comes next. That's how capitalism works.

Marketing and Marketing Analytics can easily be automated, and will be automated.

Merchandise Analytics can be automated, but is fluid and changing (especially in fashion) and will be automated far later in the process than Marketing Analytics will be. Inventory Management will be automated. Knowing what is likely to sell next? Knowing which categories matter most and are interdependent upon each other? That problem will be solved later. It will be solved, but later.

So if you want to buy yourself some time?

Focus on merchandise analytics. Your company needs you, and you can find a niche that protects you for awhile.


P.S.:  I get it, the automation might take 20 years to happen. Most likely. But what if it happens in four years? Start planning, folks. You can adapt!

April 03, 2023

Chat GPT / Category Development

I asked Chat GPT (a popular AI tool) the following question:

How much should a consultant charge for a Category Development project similar to what Kevin Hillstrom performs?

This was the final paragraph in the answer.

Given these factors, the fees for a Category Development project similar to what Kevin Hillstrom performs can range from a few thousand dollars to tens of thousands of dollars. It's important to discuss the specific details of the project with the consultant and negotiate a fee that both parties are comfortable with.

When a software application determines your value as a consultant (and this won't happen soon, but it is coming), tell me how as a consultant you overcome what the algorithm says you are worth?

Now take this a step further ... you write copy for Macy's. How are you going to defend your value against an application custom-built to write compelling copy to move products on an e-commerce site?

The automation of your warehouses ... a process you've all been through ... is coming for professional jobs. 


April 02, 2023

Special Catalog QuickScore Offer For Readers!

You are familiar with my Catalog QuickScores project.

You are familiar with my Category Development project work (click here).

So let's try something, based on your feedback.

Based on what I wrote last week (click here), let's combine the two projects in a way ... I will perform a mini-Category Development project that results in a Catalog QuickScore for each category. You can then combine/weight each score based on the composition of upcoming catalogs.

Contact me (kevinh@minethatdata.com or 206-853-8278) or visit here for additional details, price, file formats, and data requirements. Let's get busy on a unique/hybrid project, ok?

What Is An "Action Stream"?

You'll hear me talking about "Action Streams" in the next few weeks, and for good reason. What is an "Action Stream"...