Life Tables are an integral part of any Customer Development work performed by e-commerce brands. Life Tables also reveal delightful outcomes that confound the mind.
Here's a typical Life Table for a brand with existing customers that yield an approximate 31% rebuy rate on an annual basis.
You've all looked at a situation like this.
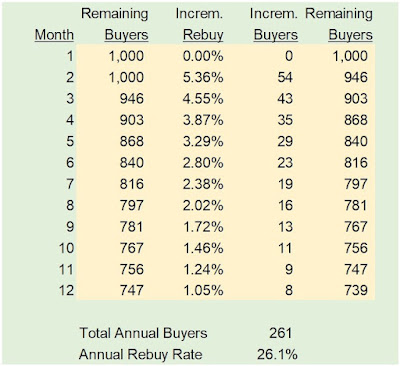
Let's run a small experiment. In the first month, let's just pretend that zero (0) of the 1,000 initial buyers repurchase. How does the rest of the year progress, even if repurchase rates after the first month are identical to normal?
Did you see what happened?
Read across the Month = 2 row in each table ... you have 50 purchasers in the top table .. in the bottom table (where nobody purchases in Month = 1) you have 54 purchasers. You make up four buyers. In Month = 3, you make up 3 purchasers. And after a full year, the 63 initial customers who were lost are reduced to 308-261 = 47 buyers.
The same thing happens in reverse ... if business is great, you get the benefit of great business early on and then, even with constant rebuy rates, the actual number of customers buying is smaller.
I receive feedback from readers - readers typically want to know how to "improve" rebuy rates. There are two ways to do this, of course.
- Sell better merchandise, and/or develop winning new items that become winning existing items.
- Spend more money marketing to customers.


No comments:
Post a Comment
Note: Only a member of this blog may post a comment.