May 31, 2022

Prioritize What You Do

A professional reached out with an odd request.

  • "Would you please prioritize what you'd do if you were me? Just tell me what we should focus on."
Here's the short list.
  1. Merchandise/Product. This is where the reader gets mad at me, but if customers don't care about what you sell, then why are you even in business? In the two years since the COVID-bump, we've largely ignored merchandise/product (outside of trying to find stuff to sell) and we're about to pay for our inability to focus on what matters most.
  2. Customer Acquisition. Nothing is more important if your rebuy rates are < 40%, which they are for most of you.
  3. Welcome Programs. Quickly convert that customer within about 12 weeks to a second purchase, or the customer essentially leaves and all of your customer acquisition work is pointless. The two programs work together, they are in harmony with each other.
  4. Email Marketing. It's essentially free and it is (outside of print) the only marketing channel you actually own and control. Why so many of you ignore email marketing is beyond me. And if the answer is "email marketing is just not very productive", well, that means you are failing. I have clients with 30% to 45% of annual sales ... from ... email marketing. Let that one sink in. 
  5. Personalization. A twenty-plus year technology used by any credible company. If you aren't personalizing all of your email campaigns and your website (and display and paid social and whatever else), you are a decade or more behind your competition.
  6. Budget Testing. If you spend $100,000/month in paid search, spend $50,000 one month and $150,000 the next month and learn how much you actually can spend. Execute holdouts in all channels where possible.
I know, I know, your favorite tactic isn't on the list.

That doesn't mean your favorite tactic isn't important - but make sure to fit your favorite tactic into the list above, as those concepts are more important and deserve prioritization.

May 30, 2022

Most Popular Run In Years

Something is going on with your businesses ... because this is shaping up to be one of the most popular MineThatData Elite Program runs of the past seven years!

Get in the program now!!

Cost?
  • $1,000 for existing Elite Program members.
  • $1,800 for first-time Elite Program members.
Data?
  • Five years of item-level purchase history, delivered in .csv format.
  • June 1, 2017 to May 31, 2022.
Timing?
  • Agree to participate by June 10.
  • Data delivered to me no later than June 15.
  • Results delivered to you no later than June 30.

May 25, 2022

Memorial Day Weekend

As is my tradition, I'm going to take a long weekend. No posts until early next week. I've been doing this for almost twenty years, and if there's one thing I've learned it is that I don't get a lot of projects because I wrote something brilliant just before or just after a Holiday.

As is my tradition, I will post less often during summer ... likely three times a week, sometimes more. We haven't had a normal work environment for two-and-a-half years ... it is important to enjoy Summer ... you don't get an infinite number of them and you don't know when you'll run out of 'em.

May 24, 2022

Dying Winners

Another metric to evaluate when looking at Winners is the quantity of what I call "Dying Winners" ... prior-year Winners that fade down into Contending status.

  • 3 Years Ago = 89 items.
  • 2 Years Ago = 112 items.
  • 1 Year Ago = 77 items.
  • As of Today = 92 items.
As we can see, the merchandising team did a good job of maintaining winners. So if winning items are being maintained but the quantity of winning items is in decline, then the Development of new winners is suffering.

These issues are quickly and easily identified, aren't they?

May 23, 2022

Shouldn't New Items Marinate A Bit Before Becoming Winning Items?

But Shouldn't New Items Marinate A Bit Before Becoming Winners?

Yeah, sure, that's the question I get and if you can develop new items to become winners in two years, then you've done something right.

So let's look at this brand and how many of the items introduced two years ago became winners within two years:

  • Introduced 4 Years Ago = 34 Winners within two years.
  • Introduced 3 Years Ago = 33 Winners within two years.
  • Introduced 2 Years Ago = 14 Winners within two years.
So yeah, sure, good question, but this company failed again on this metric.

Developing New Items is just like Developing New Customers.

We're just not good at either craft, and now that the easy profit of the COVID-bump is long-gone, we're gonna have to get back to fundamentals, aren't we?

I know, you don't want to hear that. You want a magical marketing channel to come along and make life easy.

We're gonna have to get back to fundamentals.

May 22, 2022

Post-COVID New Item Failure

Last week I reintroduced the concept of Winners/Contenders/Others.

One sign of a brilliant merchandising team is their ability to find new products that customers love. For the company I analyzed last week, here are the number of new items that became Winners that year.

  • 18 three years ago, 19 two years ago, 13 one year ago, 7 in the past year.
Yup, that's not a successful Merchandising Team, now it is?

An awful lot of you are going to dig into your data and realize that your product/merchandising teams missed some of the fundamentals they acquired prior to the COVID-bump. They stopped tracking success of new items, heck, they had a hard time even FINDING new items so they just plain struggled and now here we are, with constant stories of new product issues.

If new merchandise is < 20% of your annual sales total, you probably don't need to be as thorough on this topic as I'm encouraging readers to be.

But if new merchandise is > 20% of your annual sales total and you have results like we see above, you didn't get the job done. It's time to re-emphasize new merchandise.

May 19, 2022

Winners

Nearly a decade ago I wrote extensively about the concept of Winners / Contenders / Others. Through the years, the concept evolved a bit ... then during COVID none of it mattered because sales were up 50% and nobody cared about merchandise. Last year that began to change as some items sat on ships outside of Long Beach. This year, all of a sudden people care about what they sell ... again. 

Time is a flat circle.

Allow me to show you the number of items that were Winners for a company, items that were also Winners the prior year.

  • 289 three years ago, then 252 two years ago, then 232 one year ago, then 232 as of today.
And here are total Winners for each of the past four years.

  • 375 three years ago, then 315 two years ago, then 331 one year ago, then 282 as of today.
Subtract the difference, and we can see how well the company did at Developing Winners.
  • 86 three years ago, then 63 two years ago, then 99 one year ago, then 50 as of today.
Yeah, there it is ... a real product development issue in the past year ... the lowest total of the past four years.

This is happening for two reasons.
  1. Some of you had product availability issues.
  2. Many of you didn't care about merchandise during/after the COVID-bump.
Merchandise ... and new merchandise ... is about to become a big deal again, just like it was in 2012-2013 when I wrote extensively about Merchandise Forensics. As I mentioned earlier in the post, time is a flat circle.


P.S.:  Yeah, I know - here come the unsubs ... people grumbling that I'm not giving them tips to be successful with TikTok advertising. What you sell matters, folks. And if your merchandising/product team messes that up, you get blamed for it. So if you want to unsub because of that, go ahead. But just think for a few moments about how your business thrives ... and think for a moment that maybe your efforts are being stifled because of external factors related to merchandise/product.


May 18, 2022

Player Development

It should not surprise you in the least bit that I'm in charge of Player Development in my local Pickleball Club, now should it?

We have a program in place to teach players serves, returns of serve, ground strokes, dinking, drop shots, lobs, and overheads. The coursework is similar, but is modified for players who are at a 2.5 level vs. players who are 3.5 or above.

The goal, of course, is to accelerate the development of players. If we can accelerate the development of players, then we have more good players and more good competition and happier club members. Everybody wins!

The concept of Player Development directly ties to two issues that we talk about.

  • Customer Development.
  • Merchandise Development.
If you can speed up the time between a first purchase and a second purchase, you improve the Development of the Customer and ultimately generate more downstream profit. Yeah, Welcome Programs.

If you can speed up the sales launch of a new item, you improve the Development of the Product and ultimately generate more downstream profit. Yeah, New Product Programs are important ... not just offering 'em but finding creative ways to expose customers to the newness you already have. No, an email with a subject like of "NEW ITEMS" doesn't count.

Take Player Development tactics and apply them to Customers and to Merchandise.

May 17, 2022

Different Winners

Another challenge some of you are communicating to me is the "different winners" conundrum.

In other words, the type of items that became winners in 2019 changed (for obvious reasons) in 2020.

As inflation hit, some of the items that used to sell well stopped selling as well ... because they became too expensive. So here we are in 2022 and there are now "different winners" populating your business.

Pay attention to "different winners" ... if the items that are now selling best lead to lower repurchase rates, well, you have one additional challenge to consider. But again, you'd prefer that I warn you about this sooner than later, correct?

May 16, 2022

New Product Nightmare

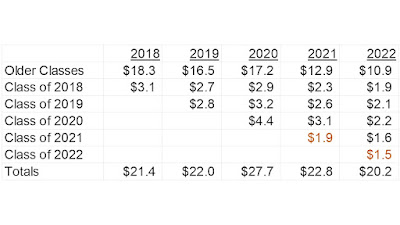
One of our readers forwarded information regarding new item performance replicated via their "Class Of" report from the 2013 work I performed in Merchandise Forensics. Here's the table (all numbers in millions):


Can you see the problem? The problem is outlined via the colored numbers in the table above. New items did $3.1 million in 2018, $2.8 million in 2019, $4.4 million in the COVID-year of 2020, then an awful $1.9 million last year due to product availability issues, and another awful projection of $1.5 million this year as new products are just hard to source.

When you fail at finding new items, you not only fail this year, you fail for subsequent years as well. In other words, the problem so many of you are telling me about (hard to find new products in our post-COVID supply chain environment) will result in downstream challenges as well.

I know you don't want to hear this message ... but you likely also want to have enough time to do something about it, right?


May 15, 2022

It's Time Again!!

Four months go by just like a snap of a finger!

It's time again for the next run of the MineThatData Elite Program. This time, in addition to the usual array of analytical masterpieces you enjoy perusing, you'll learn how each of your merchandise categories generate sales ... do sales come from prior category buyers, from cross-over buyers, or from new/reactivated buyers? In 2022 projects it is becoming clear that we don't understand what drives category success - we measure what Google Analytics tells us to measure and as a result we're not understanding how to capitalize on the categories that truly drive business success.

Cost?
  • $1,000 for existing Elite Program members.
  • $1,800 for first-time Elite Program members.
Data?
  • Five years of item-level purchase history, delivered in .csv format.
  • June 1, 2017 to May 31, 2022.
Timing?
  • Agree to participate by June 10.
  • Data delivered to me no later than June 15.
  • Results delivered to you no later than June 30.

May 12, 2022

Inflation and Price Bands

I run regressions based on future spend, dependent upon the price bands the customer previously purchased from in the past year.

The analysis looks something like this.

When prices increase, customer response changes. Customers who buy from Very Low price bands tend to spend less in the future per dollar spent the prior year. Notice the coefficients ... from $0.33 per dollar three years ago to $0.24 two years ago to $0.19 one year ago to $0.16 as of today. Basically, customers buying from Very Low price points are worth half as much as they used to be.

But wait - there's a good story here! Look at Very High price points ... the coefficients were $0.07 per dollar three years ago to $0.08 two years ago to $0.14 one year ago to $0.15 last year.

Let's pretend that customers spent $1,000,000 on Very Low price point items in the past year and $3,000,000 on Very High price point items in the past year.

  • Very Low Price Points = (0.16-0.33)*$1,000,000 = ($170,000).
  • Very High Price Points = (0.15-0.07)*$3,000,000 = $240,000.
In this simple example, you gained $70,000 of future spend as customers vacated Very Low price points and migrated to Very High Price Points during an inflationary timeframe.

You'd continue the math for Low/Average/High price point bands, and then you know what impact pricing shifts by pricing band are having on customer behavior.


May 11, 2022

I Brought This Up A Few Weeks Ago, But The Topic Keeps Popping Up Regardless

Let's look at a couple of merchandise categories.

Category A

  • Last Year's Buyers Have a 20% Chance of Buying From The Category Next Year.
  • If They Buy, They Will Spend $200.00.
  • The Gross Margin Of The Items Purchased Next Year = 60%.
  • Future Margin Value = 0.20 * $200.00 * 0.60 = $24.00.
Now let's look at Category B

  • Last Year's Buyers Have a 23% Chance of Buying From The Category Next Year.
  • If They Buy, They Will Spend $187.00.
  • The Gross Margin Of The Items Purchased Next Year = 45%.
  • Future Margin Value = 0.23 * $187.00 * 0.45 = $19.35
Which category, as a marketer, do you want to develop customers within? And I get it, some of you are going to say "both" just to be combative.

The answer, of course, is Category A. From a sales standpoint, the Category B customer is worth a bit more. But any gain is quickly offset by the difference in gross margin percentage (60% vs. 45%).

For every one of your categories, make sure you know the following:
  • The fraction of last year's buyers who will purchase again next year within the category.
  • How much the customer will spend within the category if the customer repurchases.
  • Expected gross margin percentage next year.
Then rank-order your categories from highest Future Margin Value (FMV) to lowest.

Then prioritize your marketing efforts around these differences.

Stop wasting marketing dollars on categories that do not deliver sufficient Future Margin Value.

May 10, 2022

Tradeoffs

Let's say your average price per item sold is $40.00. Your average cost of goods is $20.00. Your annual rebuy rate is 30%, if a customer purchases the customer spends $160.

  • Average Future Margin (AFM) = 0.30 * ($160 * (1 - 0.50)) = $24.00.
Now your suppliers tell you that your cost of goods increases to $24.00. If you keep prices where they are, your Average Future Margin changes.
  • Average Future Margin (AFM) = 0.30 * ($160 * (1 - 0.60)) = $19.20.
Nobody likes that scenario. Your CFO demands that you increase prices by 20%. Two things happen in this scenario.
  • Rebuy Rates Decrease by 20%.
  • Spend per Repurchaser increases by 10%.
Here is what Average Future Margin looks like:
  • Average Future Margin (AFM) = (0.30 * 0.80) * (($160 * 1.1) * (1 - 0.50)) = $21.12.
Two things happen here.
  • You recoup some of your AFM via the price increase.
  • You hurt your Customer Development efforts because your rebuy rate dips from 30% to 24%, meaning you'll have fewer customers next year, meaning you'll have less profit next year.
These are the tradeoffs every single one of you should be evaluating.

I've been amazed, in the past year, how many of you have emailed me to tell me you are not evaluating the scenarios.

May 09, 2022

Whipsawing Customer Development Issues

For many of my clients, 2020 was good for the p&l. Really good. With retail largely shelved for a few months, customers bought from e-commerce brands. A glut of new customers joined the customer file, and those customers (when developed properly, which didn't necessarily happen) rolled through the customer file through the middle of 2021, generating disproportionate profit.

During the second half of 2021, many of my clients faced inflationary pressures ... labor cost increases paired with cost of goods sold increases. Most of the clients impacted had no choice but to raise prices.

During 2022, the price increases are rolling through customer files. It's common to see reductions in rebuy rates offset by increases in spend per repurchaser. It's very common to see decreases in new customer counts as well. This is the troubling aspect of 2022. Artificial customer acquisition buyer increases in 2020 evened up a bit in 2021 and have been in decline during 2022. Now you add price increases and we're seeing a lot of new customer acquisition pressure. Pair that with rebuy rate declines and you've got a recipe for a Customer Development crisis.

A lot of old-school marketers are already committed for Christmas with product and "campaigns". These marketers have problems. I'm not very optimistic about what the second half of 2022 holds for these brands. Going into 2023, these brands won't have file power, and will likely struggle to compete. Weak companies (from a p&l standpoint) are in a lot of trouble.

Companies with strong Customer Development issues will build the customer file through early November, in an effort to capitalize on Christmas. They're going to use nearly-free tools like email and social to Develop existing customers while identifying likely prospects. They will leverage the items that still have "value" in the mind of the customer, presenting products that do not appear disproportionately expensive. They will fuse Customer Development and Merchandising Margins to grow "where possible". They will attract new customers with merchandise the customer can afford.

Blend your Customer Development strategies with Merchandise Margins, and generate as much profit as you can during our inflationary period. This is not the time to do "what we've always done" while you already increased prices and have product availability issues. That's a recipe for an awful 2022.

Do something different.

May 08, 2022

Collecting Broken Brands

Over the past fifteen years, catalog brands buckled under the stress of competition from pure e-commerce brands. You'd think the vaunted omnichannel thesis would have saved the catalog brands, because we were all told that omnichannel shoppers were worth 8x as much as single channel shoppers, but the thesis never verified. Broken catalog brands were collected, merged, with the customer who remained harvested for every last penny of profit. It's the way the world works.

In retail, the process continues. Broken retail brands are in the process of being collected (click here), with Kohl's as the latest example. Healthy retail brands do not sell themselves to mall operators. Mall operators don't purchase healthy retail brands, they cannot afford healthy retail brands, now can they?

In a perfect world, the resulting conglomeration of broken brands leads to all sorts of Customer Development opportunities. Catalogers learned this quickly, they cross-shopped customers from one brand to another, greatly reducing customer acquisition costs. Catalogers knew that if the customer bought from 2+ brands within the portfolio, profit increased significantly, helping grow the financial health of the overall portfolio. Long-term the strategy is not sustainable, of course, because you still need a constant supply of new customers entering the portfolio. But short-term, yeah, have at it.

So yes, you can buy Kohl's. But how exactly do you Develop the Kohl's customer to cross-shop JCP (and vice versa)? Trust your instincts if you don't feel comfortable with a mall operator having the myriad skills necessary to build the profitability of different customer audiences via Customer Development tactics.

It's one thing to collect broken brands and then merge operational divisions in a manner that reduces expenses.

It's another thing to properly Develop Customers. Very few people have the chops to do the proper work here, especially in an environment where unknowledgeable naysayers can block good ideas at the snap of a finger.

May 05, 2022

Question Week: Question #5

Our final question comes to us via Sherrie:  "Hi Kevin, what are the metrics you look at that tell you that your marketing is successful?"

A pretty good question to wrap up the week.

I have about 8,100 Twitter followers. Twitter does not generate business. Twitter is where you test ideas, concepts, comments, and see what the angry masses have to say. Nobody waiting to hire you is sitting there on Twitter waiting for you to say something brilliant.

I have about 1,380 blog email subscribers, with another 3,000 blog visitors per month. If I de-dupe some of overlap (not much), I likely have 29,000 "views" possible in any given month (website visits and 20 posts per month viewed potentially viewed by the audience of blog subscribers), yielding about 80 visits to the "Hire Kevin" page per month. Convert just 2-3 of those per month into a project and life is good! Visits to "Hire Kevin" are what I consider "success". Monthly blog subscribers (1,380) are a secondary measure of success.

I used to have a podcast with 3,000 subscribers. I recall one (1) paying project coming out of that endeavor ... a lot of work, not much return on that investment.

Books used to be a huge source of projects ... about 20% of my work used to come from people who read books/booklets and hired me. COVID changed that dynamic. Now, people substitute a book purchase for what used to be a paid project. Times change, we move on.

Undoubtedly, there are things I could do better. Much better! But the math outlined above yields a work-from-home model that persists ... for fifteen years now.

May 04, 2022

Question Week: Question #4

Today's question comes to us from Rhonda:  "Hi Kevin, is the COVID-bump still a real thing?"

Not really.

Here's the way to think about it. In 2020 many clients had 50% to 100% increases in Customer Acquisition, as customers marooned at home bought stuff they wouldn't normally purchase. Pretend that you normally acquire 100 customers. Now you acquire 175 customers. The difference ... 175 - 100 ... that is your COVID-bump. And I get it, existing customers likely spent more as well ... but most of your gains came via customer acquisition.

In 2021, you had 75 additional customers. Maybe their rebuy rate was normally 31%. That means that 75*0.31 = 23 customers purchased, with 52 customers lapsing. The COVID-bump of 75 customers has been mitigated by math.

In 2022, you have 23 valuable customers. Maybe their rebuy rate is 52%, yielding 12 customers with 11 lapsing. Meanwhile, you have 52 lapsed customers with a 10% rebuy rate, yielding 5 customers with 47 lapsing further. You have 17 customers purchasing.

See what is happening?
  • 2020 = 75 incremental new customers.
  • 2021 = 23 active customers.
  • 2022 = 17 active customers.
Yup, your COVID-bump is eroding.

That's what we are experiencing, folks.

And worse, with inflation running rampant, we're raising prices which causes customers to become less responsive, so the number of active customers in 2022 from our 2020 efforts is lower than we'd expect.

By next year, the COVID-bump will be a distant memory, in commerce terms. 

May 03, 2022

Question Week: Question #3

Here we go:  "Kevin, on Twitter, you've talked about the importance of incrementality. I just don't understand what you are talking about. Can you share a couple of examples? Thanks, Paul."

Here are two examples.

First, let's assume you have two product categories, "Widgets" and "Bidgets". You decide to add a third category, "Ridgets". Below are sales totals by each category, in the year before and the year after "Ridgets" were introduced.

Year Before:  Widgets = $10 million. Bidgets = $6 million. Total = $16 million.

Year After:  Widgets = $8 million. Bidgets = $5 million. Ridgets = $4 million. Total = $17 million.

Now, there are a ton of reasons why the forthcoming analysis is flawed, but at a simple level, you generated an additional $1 million in sales. However, on paper, it looks like Ridgets generated $4 million in sales. From an "incremental" standpoint, 25% of Ridgets is incremental (1 million / 4 million). That's a bad thing. When < 70% of sales are incremental, profitability of the endeavor becomes suspect.

Here's another example. Let's assume you have a terrible SEO program, so you spend a ton of money on Google. Now you improve your SEO program. Sales for the year pre/post implementation look like this (again, there are a thousand reasons why this analysis is flawed, but I'm trying to illustrate something so you can understand the concept).

Year Before:  Organic Search = $2 million, Paid Search = $10 million. Total = $12 million.

Year After:  Organic Search = $8 million, Paid Search = $6 million. Total = $14 million.

Your incremental rate is ($14 million - $12 million) / ($8 million - $2 million) = 2/6 = 33%.

In other words, you generated very little in the way of incremental sales ... however, if you can spend less on paid search and have the dollars continue to spill over into organic search, you are much more profitable and your decision is/was a good one!!

May 02, 2022

Question Week: Question #2

Here we go:  "Kevin, how should I evaluate the productivity of an item we sell? All of our reporting is channel-centric. How do I obtain a complete view of the performance of an item? Thanks, Sherri."

Good question, Sherri!

I'll share an answer with you. Not one soul is going to agree with me. Not one. Everybody will have their own ideas. Few are implementing their ideas. So let's at least get some thoughts going.

My recommendation is to evaluate item-level performance on a monthly basis. The image below is for twelve months. One can compare the current twelve-month period to a prior twelve-month period ... I'm not going to go into that level of detail here, as the concepts matter more than the comparisons.

Here's a potential template - click on it as the text is tiny, peeps.


Ok, let's explore sections of the analysis.

The top set of rows illustrate where sales come from, be it a physical channel like a call center, catalog orders matched back to the online channel, online sales by online marketing tactic, all of it rolls up to what I call Gross Demand. This is what the customer "wanted".

Then our leaky bucket subtracts some of what the customer wanted. Items that were not fulfilled and items that were returned are subtracted from Gross Demand, leaving us with Net Sales. We have units sold, and a simple division yields price per item purchased, an important metric.

The next section deviates from sales for a moment. Here we analyze how many visits the item attracted online, how many orders were generated for the item based on who viewed the item, and the conversion rate for customers viewing the item.

Here's the part you won't like. It's hard to generate this information at an item level, but it is absolutely necessary. On a monthly basis, you sum ad costs by marketing channel ... at an item level. Yup, not easy, and you'll come up with a thousand reasons why you shouldn't do this (but the real reason is because it is hard to do it). If you have a catalog, allocate square inches against your life-of-catalog curves (i.e. 40% of sales happen in week one, 30% in week two, 20% in week three, 10% in week four), yielding an ad cost for that specific item.

Digitally, this becomes interesting as well. If a customer visited from search and looked at three items, the cost of that click is allocated to the three items the customer looked at. If a customer visited your home page and bounced, you allocate that visit across all items equally (I know, that can be punitive, but you'll view your assortment differently after doing this). Sum up all ad costs, and you've got the amount of marketing dollars spent against that item for that month.

That's a big deal, folks!

Sum up your pick/pack/ship expenses for that item next. This gets you to what I call "Variable Profit" ... it's the amount of profit the item generates prior to fixed costs. Fixed costs don't change as sales change, so you don't evaluate fixed costs in this framework.

Again, this style of analysis requires hard work and discipline, so most readers aren't going to pursue this path.

If you want to know how profitable each item is, pursue this path, ok?

The next three rows evaluate gross margin dollars and rates. Obviously this is a big deal.


May 01, 2022

Question Week: Question #1

Here's a question:  "Hi Kevin, listen, I just don't understand your obsession with margin and profit. Who cares? Let the CFO figure out if our efforts matter, and if they don't matter let the CFO bring the hammer down. I just want to do my job. Thanks, Henry."

Henry, what is wrong with you?

I've worked with more than 250 companies. Maybe 20 of those companies thoroughly understood margin and profit. Those companies, not surprisingly, were "high performers" ... their rate of generating profit was high, their ability to generate profit was high, and the bonus levels of the employees was "high".

I've spent the better part of 2022 talking about margin/profit. The feedback I've received has been fascinating. One individual on Twitter told me that his company didn't know what their products cost. Come on! And when I explained how one might arrive at an estimate, he threw up roadblock after roadblock. In other words, he didn't want to know how much his products cost, because if he knew he'd have to make different decisions.

Another individual argued with me, suggesting that Return on Ad Spend (total sales divided by total ad spend) is the metric that matters most. Come on! ROAS is essentially profit if you just take the calculation a few additional steps. Why not do the work? Why be lazy?

I repeatedly hear the phrase "I just want to do my job". Lazy. That means you want to do your job with imperfect information and you don't care if you are sub-optimizing your business.

What if the CFO decided that your salary would be variable, and based entirely on the gross margin dollars you generate? What would you do in that situation? We both know the answer, don't we?

Just because Google Analytics waters down your analytics to the point of "scalable homogenization" doesn't mean you should play along with Google.

Do the work!

Accountability

Part of the system I advocate is a process that leads to Merchant Accountability. This can happen in many different ways. At Nordstrom, Blak...