April 28, 2022

It Has No Impact On Margin, So Now What?

Yesterday I shared this little tidbit from a company:

  • Gross Margin Percentage, 1st Order = 53.9%.
  • Gross Margin Percentage, 26th+ Order = 50.2%.
This prompts a reader to ask:
  • "Kevin, so what? Margin percentages are essentially the same. It's irrelevant."
On a $101.00 average order value, it is relevant.
  • $101.00 * 0.539 = $54.44 Gross Margin.
  • $101.00 * 0.502 = $50.70 Gross Margin.
It means that best customers are giving up $3.74 of gross margin ... per order.

When you consider that a typical e-commerce brand is producing 5% to 10% pre-tax profit on an annual basis you don't want to just give up essentially HALF of it at an order level by being careless with your gross margin dollars.

Stop being careless with gross margin dollars.

Start protecting profit, ok?

April 27, 2022

How Do We Treat Our Customers? It's Interesting

In any Hillstrom's Profit project, we take a look at how customers are treated along the customer life-cycle.

Here's how one company generates differing metrics along the customer life-cycle.

Price per Item Purchased:

  • $32.08 first order.
  • $30.63 second order.
  • $30.28 third order.
  • $29.91 fourth order.
  • $29.86 fifth order.
  • $29.19 6th-10th order.
  • $28.46 11th-15th order.
  • $27.69 16th-25th order.
  • $26.98 26th+ order.
Gross Margin Percentage:

  • 53.7% first order.
  • 53.6% second order.
  • 53.7% third order.
  • 53.9% fourth order.
  • 53.8% fifth order.
  • 53.5% 6th-10th order.
  • 52.9% 11th-15th order.
  • 52.1% 16th-25th order.
  • 50.2% 26th+ order.
Percentage of Items Sold Below Their Historical Average Price Point.
  • 50.9% first order.
  • 52.9% second order.
  • 53.1% third order.
  • 53.2% fourth order.
  • 52.9% fifth order.
  • 53.9% 6th-10th order.
  • 55.5% 11th-15th order.
  • 56.7% 16th-25th order.
  • 59.9% 26th+ order.
How are first-time buyers treated? Expensive items at high margins, paying full price.

How are best customers treated? Less-expensive items at lower margins via discounts.

I know, there's a fraction of the audience that will suggest it is fine to tickle the buying bone of best customers with best prices. Sure. But that also means that Management is happy to let profit just drip out of a hole in a bucket. Eventually, that kind of behavior comes back to haunt Management.

April 26, 2022

Looks Good On The Surface

Here's a sleepwear category. On the surface, sales look good, they're increasing.


But "how" are they increasing?

In the past three years, we've seen a huge change in how sales are generated.

  • Items selling at/above their historical average, new items ... -72%.
  • Items selling at/above their historical average, existing items ... +8%.
  • Items selling below their historical average, new items ... -70%.
  • Items selling below their historical average, existing items ... +106%.
Oh oh.

Three years ago about a quarter of what was sold was existing items at a discount.

Today, about 60% of what is sold is existing items at a discount.

So the sales gain is mostly meaningless.

It's hard for the CRM folks to measure their lifetime value stuff and make judgments about how much to invest in marketing channels if they have no idea how the merchants are playing around with margins. Things might look good on the surface, but drilling down just a little but changes the story (in this instance).


April 25, 2022

Somebody Made a Bad Decision

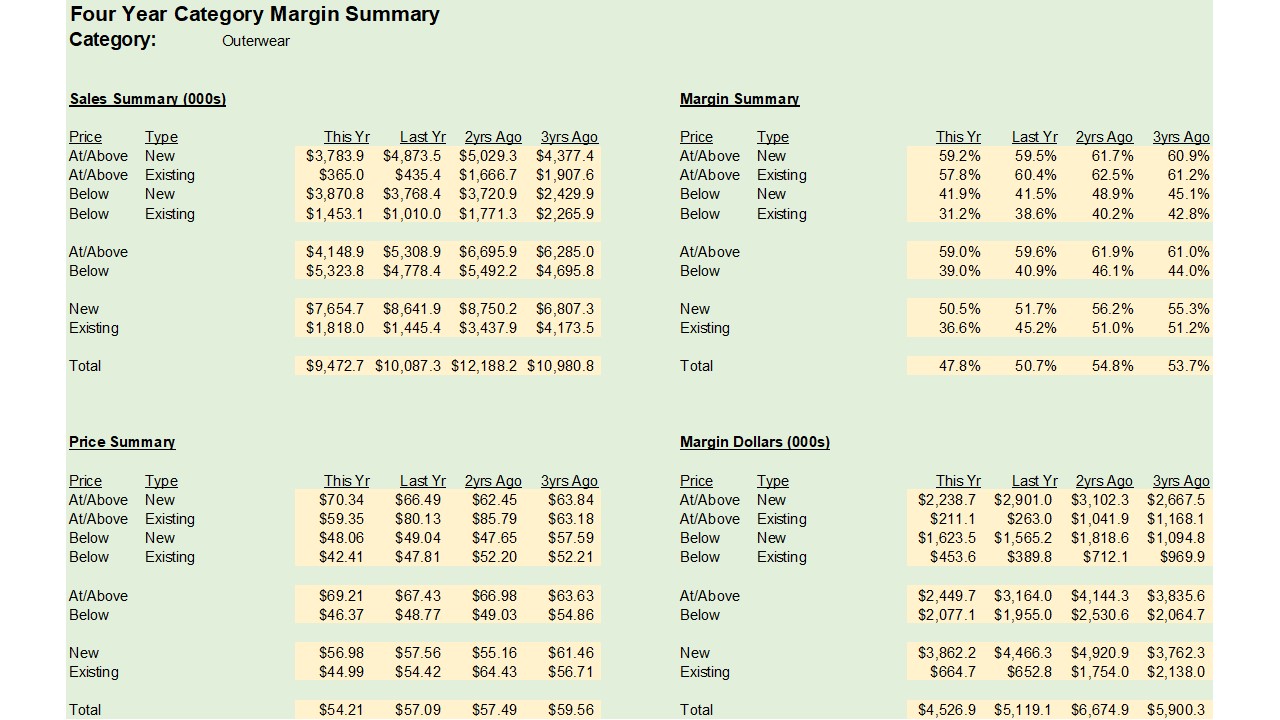
Here's our Category Margin Summary for Outerwear.


The category is dying, isn't it?

There's a secret to the poor performance ... look at sales of existing items by year.

  • $4.2 million three years ago.
  • $3.4 million two years ago.
  • $1.4 million one year ago.
  • $1.8 million last year.
Let's also look at margin percentage for existing items by year.
  • 51.2% three years ago.
  • 51.0% two years ago.
  • 45.2% one year ago.
  • 36.6% last year.
To me, it looks like the Outerwear merchant made a bad, bad decision. It's like s/he decided to throw away the existing assortment ... discounting the living daylights out of what was left. However, whatever was newly introduced didn't resonate with the customer (sales of new merchandise increased two years ago and then held flat and are now in decline). This happened two years ago, and the results have not been positive. Well, they weren't bad for a year.

We can see the problem in the upper-left portion of the table. Look at annual sales of existing items selling at/above their historical average ... $1.9 million to $1.7 million to $0.4 million to $0.4 million. The merchant just stopped selling existing items at full price. S/he clearly discontinued existing items.

Now look at the bottom right portion of the table ... total margin dollars by year ... from $5.9 million to $6.7 million to $5.1 million to $4.5 million. The merchant made a bad decision ... one that worked for a year and has now caused damage to the category.

This kind of stuff is happening at your company, too. This kind of stuff hurts conversion rates, hurts email click-through rates, hurts your cost per order in search. It hurts you, the marketer. You don't want to be accountable for stuff the merchant causes.

That's why you have to analyze your business in this manner, correct?


April 24, 2022

Breaking Down Profit - The Category Margin Summary

Here's a four year Category Margin Summary for Outerwear. This is a new table you have yet to view.


How is Outerwear performing? Not so good.

Sales dropped from $12.2 million two years ago to $9.5 million today.

Look at items selling At/Above their historical price vs. Below their historical price. Look at sales of new items vs. sales of existing items.

There is something that REALLY stands out here ... it's the secret behind this category. Take a look at the table, and I'll share the secret tomorrow.


April 21, 2022

Meanwhile, A Thriving Category!

If there is negative news, there's likely to be positive news somewhere else.

Here is a category that grew from $13.0 million three years ago to $18.7 million last year. This category is on the move!!

Existing Category Buyers:
  • Rebuy Rates improved from 21.9% three years ago to 23.2% today.
  • Spend per Repurchaser improved from $107.58 to $134.70 in three years.
Existing 12-Month Buyers, No Category Activity Past Year:
  • Rebuy Rates improved from 7.0% three years ago to 7.6% today.
  • Spend per Repurchaser improved from $90.16 to $110.92 in three years.
New/Reactivated Buyer Counts and Spend:
  • Counts improved from 52,895 three years ago to 64,626 today.
  • Spend per Repurchaser improved from $86.06 to $108.60 in three years.
Existing buyer rebuy rates are up 6% ... twelve-month buyers with no twelve-month category buying activity are up 9%, and new/reactivated buyer counts are up 22%.

Not only is this category having healthy gains ... but it is having healthy gains among the least-engaged customer segments.

This is what success looks like!

And among existing category buyers, share of spend within the category has increased from 8.8% to 10.9% in three years.

And that's where the story turns.

Look at what happened in the past year for prior category buyers in all other categories:
  • Rebuy rates dropped from 59.8% to 56.5%.
  • Spend per repurchaser decreased from $276 to $255.
So the category is thriving, but customers buying from the category are walking away from the rest of the brand. This isn't always the case, but is a bad sign for the rest of the brand.

Customers exhibit interesting behavior. They can love one category but be turned off by the rest of the brand. Make sure you figure out what is driving customer behavior and act upon it, ok?


April 20, 2022

A Dying Category

There's so much going on in this Category Buyer Analysis. Here we go.


Let's look at sales by year ... it's a negative trend, from $1.8 million to $1.6 million to $1.5 million to $1.4 million. The category is dying.

How about those who bought from the category in the past year? Their rebuy rates are consistent over time (19.2% then 17.8% then 19.4% then 18.9% last year). Existing buyers are going back to this category. If they buy? Their spend improved over time ... $74.08 three years ago, then $78.19, then $85.32, and $92.16 in the past year.
  • Rebuy Rates are mostly steady.
  • Spend per Repurchaser Improved Significantly.
Existing buyers are not the reason why this category is dying.

How about all of the other 12-month buyers ... those who have not purchased from this category in the past year?
  • Rebuy Rates are dying ... from 3.9% to 3.6% to 3.3% to 2.9% last year. The rest of the customer file (i.e. the majority of customers) are walking away from this category.
  • Spend per Repurchaser increases ... $58.02 to $58.25 to $62.70 to $67.74 last year.
  • The multi-year rebuy trend (-27%) does not offset the multi-year spend increase (+17%).
New/Reactivated buyers?
  • 26,555 three years ago to 22,547 to 20,532 to just 16,743 last year.
  • Oh boy.
  • The multi-year trend is -37%.
What is the multi-year rebuy/buyer trend by customer type?
  • -2% for existing buyers (but +2% for all other products).
  • -27% for 12-month buyers without purchase in the category in the past year.
  • -37% for new/reactivated customers.
This is what dying categories look like. Prior buyers are the last to fold - those with no attachment to the category walk away first.

You also have to wonder if the marketing team is causing part of this problem? You have to ask the question. For instance, if the marketing team won't spend money on keywords tied to this category because margins are low (they are low for this category compared to other categories), then the marketing team is contributing to the problem, albeit with profitable intentions.

A few additional tidbits.
  • Gross Margins were 41% three years ago, they are now 37%.
  • Price per Item Purchased was $31.24 three years ago, now is $41.88.
  • Somebody raised prices over time, achieved unfavorable results, then started discounting to bring customers back.
This category had 74,246 customers three years ago. It has 54,017 today. The category is dying. This is where Merchandise Forensics work comes into play - you perform a deep dive into this category to understand why the category is performing so poorly.


Content Creation

Here's the link . I realize many of you are stymied by creating content for your customers. Some of you would say the video above is poi...