Showing posts with label Grids. Show all posts

May 13, 2015

Partnering With Amazon

You could do the hard work to acquire your own online buyer - and get a summed repurchase probability of about 24%.


Or, you could beg Google for a customer ... paying Google for the current transaction and for nearly half of future transactions ... and you could acquire a customer that is less valuable (sounds good) with just a 19% summed repurchase rate.


Or, you could be "strategic" and partner with Amazon. Pay Amazon. What happens?


A summed 15% annual repurchase rate ... so you acquire a customer even less valuable, you pay Amazon for the right to enjoy this customer, and twenty-six percent of future purchases go to search, enabling Google to jump in on the profit you used to generate.

You're probably running these analyses, and you fully understand how your strategic vision impacts the future trajectory of your business, right? Rest assured, Google and Amazon know what happens. They love it when you put your strategic omnichannel hat on and open your wallet and pay them for the opportunity to share a customer.

Or, you could do the hard work to harvest your own customer, a customer worth much more to your business.

The choice seems pretty simple, doesn't it?

May 04, 2015

Ok, You Succeeded - You Acquired A Paid Search Buyer

There it is ... your online marketing manager clinks a glass of champagne with the paid search vendor ... as yet another customer has been acquired via paid search. Where is this customer headed in the next year?


Where does nearly half of future purchase probability lie? Search! No wonder Google makes money. The customer is more likely to buy via search than to buy via your own website, in this instance. You want access to this customer (your customer)? Pay Google.

We all manage businesses, and those businesses are part of a big 'ole bubbling ecosystem. Do you understand why the omnichannel community wants you to "do everything"? They get paid, that's why! That's why Google wants to demonstrate the link between search and mobile and your in-store retail sales ... you'll pay them for access to your own customer!

You are actively shifting future customer trajectory via your own marketing actions. Every day, you feel excited to go into work and make magic happen. When you acquire the paid search customer, you make magic happen ... for Google. They key, then, is whether you can earn enough profit for your own business while helping Google achieve world dominance.

In the table, 43.5% of subsequent purchases come in via search. This means that you're going to rack up future expense, aren't you? With another 2.5% via affiliates and 5.2% via Amazon, you're up to 51.2% of future purchases with an associated toll.

Tolls pop up everywhere. For the cataloger, co-ops represent a toll. For the cataloger with a strong online marketing program, you mail co-ops names (toll) and then the customer visits Google (toll) and then the customer puts an item in the shopping cart and you don't want the customer to leave so you offer 20% off plus free shipping (toll) and then the customer visits an affiliate and finds a better offer (30% off plus free shipping), and uses the better offer (toll) and then you pay the affiliate for the order (toll).

Omnichannel marketing is all about tolls. You are asked to pay a lot of tolls. Do you get the sales necessary to cover the cost of the tolls and have profit left? That's what we need to focus on.

April 27, 2015

Email Marketing Changes Response Patterns

Alright friends, take a look at this one. Here's a customer who last purchased online 7-9 months ago. Our prediction, for the next year, is as follows:


The customer is pre-disposed to buy via online and search channels, going forward. Nothing wrong with that. But your email marketing team, well, they care, they care deeply about getting the customer to buy via email marketing.

Let's try something. Let's pretend that the customer was going to buy online for a second time. Here's what the customer trajectory would look like:


Nearly eight in ten subsequent purchases would happen via online/search, if the customer were allowed to buy online. However, your email marketing team want the next order to happen via email marketing. They crave it. They're going to make it happen! And when they make it happen, they change the trajectory of future customer behavior.


There are two things worth noting, in this example. First, when evaluating share of future spend, we observe that share has been shifted - away from the online channel, more into the email channel. Going forward, email is going to be more important to this customer.

Second, and more important - look at the individual row-based repurchase rates by channel ... what do you see? Clearly, the customer is more valuable now. Email, in this case, caused the customer to simply become more valuable to the business.

For this business, you want the email marketing team aggressively going after customers, because when the customer buys from email instead of the online channel, the value of the customer simply improves.

Your business is a big, bubbling ecosystem. You are not "omnichannel", you are an ecosystem ... and within the ecosystem, there are good choices and there are bad choices. You want to pursue good choices. In this case, email represents a good choice.

Contact me (kevinh@minethatdata.com) for your own, customized triggers & grids project.

April 22, 2015

Lousy Website Optimization

This problem keeps coming up in the projects I work on.

I create a model that predicts how many orders a customer will place in the next month.

Then, I create a model that predicts how many days (called "monthly visits" in this example) a customer will visit your website next month.

Finally, I segment customers based on the two predictions.

The lower left cell (green) represents customers who are unlikely to purchase, and are unlikely to visit. Notice that this cell has the second best daily conversion rate (purchases / days visited).

The upper left cell (orange) represents customers are are likely to purchase, but are unlikely to visit. Notice that this cell has the best daily conversion rate (5.5%). In many ways, this is the customer your visit-centric metrics are trying to optimize ... their conversion rate is good, but they don't use your website much.

The lower right cell (blue) represents customers who are not likely to purchase, but are likely to visit. You'd expect a lousy daily conversion rate, and you get precisely that (1.9%). Marketers HATE this cell ... they do anything they can (discounts/promotions/begging) to get this customer to purchase. You won't get this customer to purchase ... this customer likes to visit, to browse.

The upper right cell (yellow) represents customers who are likely to purchase, and who are likely to visit your site often. This is the dream customer - fully engaged with the site and very willing to purchase. What is the daily conversion rate for this segment? A paltry 2.1%. Your best customers have horrible conversion rates, in this example (happens all the time, folks).

Your staff will work overtime to get the customers in the upper right quadrant to purchase NOW!! Cart abandonment programs, programmatic approaches & retargeting, keyword bidding, discounts/promos in email campaigns. STOP IT! Just STOP IT! These customers already love your brand - they just love it so much that their visits overwhelm their purchases. You DON'T CARE that this customer has a low conversion rate ... so what?! Collect the profit.

Show of hands ... how many customers do you have that fit into each cell above? If you don't know the answer, send me an email (kevinh@minethatdata.com) and I'll get busy creating the cells for you.

April 21, 2015

Triggers & Grids: Combining Attributes

Let's look at an example ... in the table below, I illustrate Logistic Regression coefficients for the likelihood of a customer buying from email marketing in the next twelve months. The rows represent recency  ... the columns represent prior purchase channels.


Let's pretend we have a customer who has only ever purchased one time, and it was via email marketing, and the customer spent $100, and the purchase happened one month ago. For that customer, the probability of buying from email marketing in the next year is ... (-5.216 + 2.423 + 1.841*(100/1000)) ... we obtain a logit value of -2.519, which when transformed (EXP(-2.519) / (1 + EXP(-2.519)) = 7.5%.

Now let's pretend that the customer also purchased ($100) via Amazon in the past month ... the equation changes to (-5.216 + 2.423 - 0.031 + 1.841*(100/1000)) = -2.550, which is then transformed (EXP(-2.550) / (1 + EXP(-2.550)) = 7.2%.

Do you see what happened there? The very fact that the customer just purchased from Amazon actually caused the customer to become less likely to buy via email marketing. #OhBoy.

Each of our businesses possess customers who exist within an ecosystem. A very interesting ecosystem! We've been trained that each incremental purchase is good. Most of the time, each incremental purchase is good! But sometimes, odd dynamics occur. We need to understand odd dynamics.

In subsequent posts, I'll show you how these models can be used to combine attributes, and when attributes are combined, we can understand how customers behave and evolve as we promote different channels. The activity leads us to create different trigger strategies for various customers.

For instance, here are a set of customer attributes (the customer bought via the phone 10-12 months ago, spending $100), and the predictions by channel.


This customer has a 9.9% chance of buying via phone next year ... that's 60% of all outcomes. Now, look at what happens when the customer reactivates via Amazon ... becoming a 0-1 month $100 Amazon customer and staying a 10-12 month $100 Phone customer.


In the short term, the Amazon purchase helps catalog responsiveness ... trigger off a catalog, folks!

But not so fast. Let's let one more month pass ... now the Amazon purchase is 2-3 months ago.


Within just a month, the Amazon purchase helped phone response (catalogs), then hurt phone response (catalogs). Also, look at what happens to Search response in each grid ... low ... then high ... then higher. Yes, the Amazon purchase pushes the prior catalog-centric buyer online, where the prior catalog-centric buyer "engages" in online activities that will cost you even more money.

In other words, the Amazon purchase should trigger a catalog, and then, it is quite possible that you might cut back on mailings because response drops and paid search response increases, costing you more money.

So this is the stuff we're going to talk about ... your customers interact with your business in fascinating ways, yielding an ecosystem that is not well understood. By combining attributes in a Logistic Regression equation, we set off all sorts of interesting ecosystem findings, don't we?

April 19, 2015

Triggers & Grids: Grading Strategies

Modern customer behavior is perceived to be much more complicated than it was twenty years ago. That may or may not be true.

Twenty five years ago, you created several hundred RFM segments and you called it good. Today, your three hundred RFM segments would overlay against twenty marketing channels, getting you ever closer to an infinite number of segment combinations. Is it any wonder folks want you to have a "one-to-one" relationship with a customer? It's become hard to segment the customer in a meaningful way.

It is perfectly reasonable to simplify the number of dimensions you deal with. I create simple models ... in the case above, a model for a product line called "Widgets", and a model for a product line called "Wudgets". The predictions for each model are reduced to five segments ... sort of like when you were in school ... A/B/C/D/F.

Then, I measure future "Widget" spend across the A/B/C/D/F grades for "Widgets", and A/B/C/D/F grades for "Wudgets". In other words, let's pretend that the customer is a prior "Widgets" buyer, but has never ever purchased "Wudgets". We'd look across the "A" row for Widgets, and then align with the "F" column for Wudgets ... the customer is worth $44.38 to the Widget merchandise category.

Say you have an email marketing campaign for Widgets ... you know that the customer must be worth at least $30 of future spend to generate a productive Widget email campaign. Even if the customer has not purchased Widgets in the past ("F"), a recent Wudget purchase might move the customer into A/B territory for Wudgets ... and when that happens, the customer has sufficient value to email the Widget campaign.

Better yet, you can build Wudget purchase intelligence into the Widget model ... and by doing so, you eliminate the need for the grid altogether ... you trigger/target based on the Widget grade.

April 14, 2015

But A Recent Buyer Is A Good Buyer, Right?

For the most part, a recent buyer is a good buyer ... right?

Let's take a second look at the grid from last Friday.


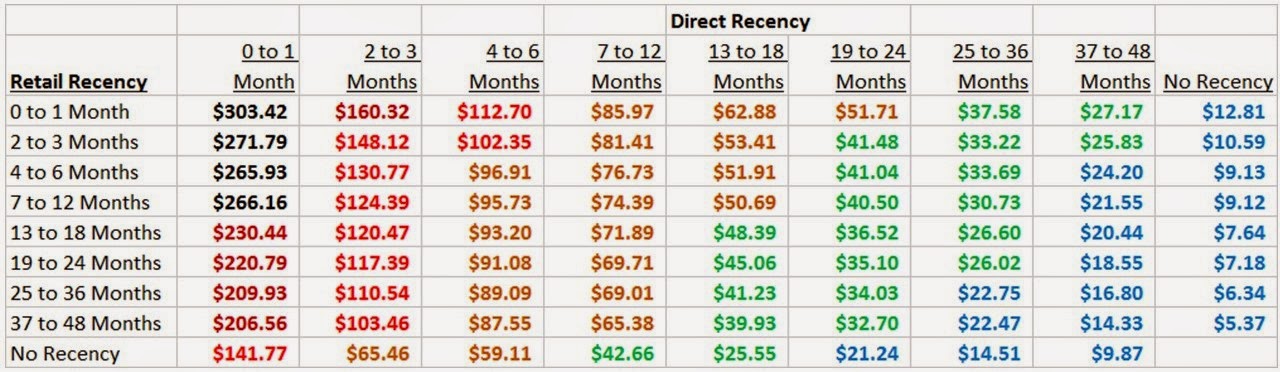
This table measures direct-channel value for a business that has retail stores and an e-commerce website. So read down the 7-12 month direct recency column ... if the customer has never purchased from retail, the customer is worth $42.66 demand to the direct channel. But now, the customer (surprisingly) walks into the store and buys something. Everybody is happy! Everybody, that is, except for those who manage the website.

Why?

The value of the customer to the website went up, quite a bit, from $42.66 to $85.97. But the customer is nowhere near as valuable as a recent online buyer (between $141.77 and $303.42).

I know, I know, the omnichannel experts will tell you that this doesn't matter.

It matters if it is your job to forecast online sales, right?

It matters if it is your job to forecast online inventory, right?

It matters if it is your job to forecast online traffic, right?

The omnichannel movement is sweeping vital business details under the carpet. Omnichannel advocates don't care where the customer buys.

Your CFO cares deeply where the customer purchases ... where the customer purchases dictates future sales, and future sales require staffing and inventory and proper forecasting techniques ... and ... they require proper triggers/targeting strategies. In this case, the customer just bought from the store ... why send emails demanding that the customer take advantage of a free shipping offer when the customer just bought from a store?

Our future includes a full incorporation of purchases across all channels ... we encourage the customer to purchase anywhere ... but we react VERY DIFFERENTLY when the customer buys from a specific channel. The omnichannel thesis of "do everything digital" simply makes no sense in a world where we can clearly see how the customer will behave in the future.

Send me an email (kevinh@minethatdata.com) if you need assistance with grids and triggers.

April 09, 2015

Triggers And Grids

Our future includes a shift from pure campaign-centric work to grid-centric triggers. Oh, I know, countless pundits have been telling us this for decades ... they tell you how their cloud-based machine learning application will uncover patterns you'd never anticipate. 

But the reality is that we must combine business experience with math ... unfortunately, we tend to omit the business experience portion of the equation.

Take a look at this grid ... the grid illustrates how much a customer with various recency-oriented direct-channel and retail-channel attributes will spend online in the next year:


Grids help us understand customer value. Grids help us understand whether we should change our behaviors or not.

Look down the "Direct Recency = 25 to 36 Months" column. This column shows us how much a 25 to 36 month direct channel buyer will spend online, in the next year, by in-store retail recency segments.

Let's pretend that we have an online buyer with no retail history ... that customer is expected to spend $14.51 online in the next twelve months. Now, look at what happens when the customer buys from a retail store ... the customer moves up the column, and moves into the "0 to 1 Month" recency segment. Online value increases ... from $14.51 to $37.58.

Conversely, read across the bottom row ... let's pretend that the customer buys online instead of buying in-store. Now, the customer moves from $14.51 of online value to $141.77 of online value.

The retail purchase has very little influence on online value. The retail purchase would likely trigger a different email cadence - one that encourages the customer to learn more about the store.

The online purchase has significant influence on online value. The online purchase would trigger a different email cadence - one that encourages the customer to continue to shop online.

Grids quickly become complicated ... it's hard to move beyond two dimensions. A good idea, then, is to create models that combine numerous attributes into one dimension. You predict, on an A/B/C/D/F basis, the value of the customer online, and you predict, on an A/B/C/D/F basis, the value of the customer to a retail store. Then you have a 5x5 grid ... and better yet, you have multiple 5x5 grids that show retail value, online value, and company value. Based on customer value, you trigger the customer into different marketing programs.

In the coming months, we're going to talk more about grids, about models that combine attributes, and the triggers we use to capitalize on customer behavior. The goal is to expand business knowledge ... in terms of your career, business knowledge > machine learning applications.

March 11, 2007

Online And Offline Marketing Interact To Drive E-Commerce Sales

There are several interesting tricks that multichannel retailers can use to understand the interaction between online and offline marketing.

One such trick is to create "grids" that explain how online and offline marketing drive sales. A "grid" is a simple 2x2 table that shows the impact of two factors on sales volume.

The tables at the end of this post illustrate how a multichannel retailer might use a "grid" to measure the combined influence of Google, and a Catalog mailing.

In this simplistic example, the multichannel retailer observes a positive impact on conversion rate due to catalog mailings, and a positive impact on conversion rate due to a customer referred via paid and natural search at Google.

Multichannel CEOs and CMOs: Our multichannel marketing environment has grown more complex. Industry pundits tout the advertising vehicle they support, for obvious reasons. It is important for your staff to demonstrate to you the combined impact of online and offline marketing activities. Start your week off on the right foot, by spending a few minutes with your analytical folks. See if they can produce the following table for you:


Here's the table:

Number of Visitors

Catalog = Yes Catalog = No
Google = Yes 25000 75000
Google = No 125000 350000


Conversion Rate

Catalog = Yes Catalog = No
Google = Yes 5.3% 4.1%
Google = No 3.7% 1.4%


Average Order Size

Catalog = Yes Catalog = No
Google = Yes $150 $140
Google = No $175 $160


Net Spend Per Visit

Catalog = Yes Catalog = No
Google = Yes $7.95 $5.74
Google = No $6.48 $2.24


Total Volume


Catalog = Yes Catalog = No
Google = Yes $198,750 $430,500
Google = No $809,375 $784,000


Percent Catalog Influenced 28.3%
Percent Google Influenced 45.4%

An Ecommerce Brand Is Constantly Reinventing Itself

A year or two ago I received an email ... the Leader asked "what happened to all of those COVID customers, it's like they just disa...