September 09, 2009

OMS: Optimizing Paid Search And Customer Acquisition

Let's tackle a question that we all eventually have to deal with. Somebody is requiring us to cut back on an advertising channel. Maybe the CFO did an analysis, and thinks that the ad-to-sales ratio in paid search is too high. She demands that we cut our paid search program by 50%.

The online marketer and web analyst work together to cobble conversion rate reporting, and if available, profitability reporting, attempting to make a case to continue to spend money. And this is a good thing. Your web analytics reporting helps you see what happened in the past. Your reporting shows you that you're losing a lot of money at the margin in your paid search program. It sounds like your CFO is right.

Your CEO, however, will want to know what will happen in the future if the CFO gets her way and cuts your paid search program in half. Your job is to make a case to the CEO to keep spending the money. You have to prove that there is a long-term return-on-investment that must be protected.

This is a perfect application of the Online Marketing Simulation, the "OMS" as I call it. Why not simulate what happens over the next five years if your paid search budget is cut by 50%?

First up, the current plan.
  • Year 1 Demand = $19.1 million, Profit = $0.6 million.
  • Year 2 Demand = $19.3 million, Profit = $0.7 million.
  • Year 3 Demand = $19.5 million, Profit = $0.7 million.
  • Year 4 Demand = $19.6 million, Profit = $0.8 million.
  • Year 5 Demand = $19.6 million, Profit = $0.8 million.

This information alone would be good for your CFO and CEO to see. When is the last time you showed your Sr. Management team where your online business is heading, from a sales and profit standpoint, over the next five years? In the old days, you'd put your finger in the air and guess that a 35% sales increase would happen, and then you'd be praised when you had a 45% sales increase. Unfortunately, for most of us, those days are gone.

Ok, now we plug the 50% reduction in the paid search budget into the OMS.

  • Year 1 Demand = $18.2 million, Profit = $1.0 million.
  • Year 2 Demand = $17.5 million, Profit = $0.8 million.
  • Year 3 Demand = $16.8 million, Profit = $0.6 million.
  • Year 4 Demand = $16.1 million, Profit = $0.4 million.
  • Year 5 Demand = $15.4 million, Profit = $0.1 million.

Which business would you rather be part of?

So often, our customer acquisition activities are unprofitable, and are the first area that the CFO wants to cut. If you're using your standard web analytics platform, you're going to look at conversion rates and average order values and you'll end up agreeing with your CFO.

If you run your customers through the OMS, simulating the long-term migration of your customer base, you'll arrive at a different answer. The example I illustrate above repeats itself across the data I analyze.

Short-term optimization frequently results in a long-term drain on the business. It is here that the web analytics community are sometimes sold the wrong message. We're told about these glorious optimization tests, we even read about how offline data is integrated into the multivariate tests that result in an optimized outcome. It all sounds really good.

Until we do a better job of simulating the long-term impact of our decisions, we won't know if we're actually optimizing our business, or if we're hurting the future of our business. It is time for the online marketing and web analytics community to take the next step!

September 08, 2009

OMS: Optimizing Landing Pages

In old-school catalog marketing, it was hard to isolate the impact of any spread in a catalog. But in e-commerce, we have better metrics, metrics that help us understand the best ways to merchandise our website. We're grateful that we have talented web analytics experts and great software to guide us through the decision-making process.

Now we have the Online Marketing Simulation, the "OMS". And for many of us, we finally have a tool to understand the long-term impact of a shift in merchandising strategy.

In one dataset, I looked at thirteen merchandise divisions. Two of the merchandise divisions underwent significant online changes, one was featured prominently due to conversion rate improvements, one was de-emphasized because conversion was poor.

Given the results, I can simulate the five-year impact of this short-term decision.

In terms of annual sales, there was no difference between the old strategy and the newly optimized strategy, over a five year period of time. In essence, we emphasize one division, shifting business to that division. But long-term, customer spending habits are unchanged.

What did change was the distribution of sales by merchandise division, over time. After five years, here's how merchandise sales were altered:
  • Merchandise Division #1 = +4.2% (this division was emphasized due to optimization results).
  • Merchandise Division #2 = +2.4%.
  • Merchandise Division #3 = +0.9%.
  • Merchandise Division #4 = -2.6%.
  • Merchandise Division #5 = -6.0% (this division was de-emphasized due to optimization results).
  • Merchandise Division #6 = +1.2%.
  • Merchandise Division #7 = -0.3%.
  • Merchandise Division #8 = -1.5%.
  • Merchandise Division #9 = -2.4%.
  • Merchandise Division #10 = -1.8%.
  • Merchandise Division #11 = -3.1%.
  • Merchandise Division #12 = -2.1%.
  • Merchandise Division #13 = -2.7%.

By making simple changes to the merchandising of your landing pages, you unwittingly impact the long-term sales trajectory of many of your merchandising divisions. You subtly shift customer behavior.

The Web Analytics practitioner and Online Marketing expert can both benefit from the OMS environment. Imagine being able to sit with your Executive leadership team, helping them understand how decisions being made today impact the future of your business? We move beyond simple conversions and KPIs, instead gaining insight into what our business looks like in the future. Who wouldn't want to know what the future of our business looks like? Who wouldn't want to know how his/her own personal actions are influencing the future trajectory of the business?

And if you don't think this information would help your organization, why not use the comments section to describe the reasons why? There's nothing wrong with a dissenting point of view, it may make for a good discussion!

September 07, 2009

Blog Topics For Fall 2009

Summer is gone now, replaced by cooling temperatures, frost, and football!

During the summer, we took the content on this blog in a different direction. We went from 9.0 posts per week to 4.5 per week. We shifted the focus from general topics and Multichannel Forensics to Gliebers Dresses and the Online Marketing Simulation. We moved a lot of the other information over to Twitter. Readership and subscriber metrics suggest that this was a very good move. Gliebers Dresses is the most popular series ever written on this blog. The Online Marketing Simulation is so popular that it appears to be the likely successor to the Multichannel Forensics product so many of you have used.

Now it is your turn to voice your opinion.

Is the blog serving your needs? If not, what kind of content would you recommend for this fall?

Starting next week, I'm leaning toward the following schedule:

  • Monday = Catalog / Multichannel Forensics Topics.
  • Tuesday = Online Marketing Simulation.
  • Wednesday = Gliebers Dresses.
  • Thursday = Online Marketing Simulation.

Use the comments section below to recommend the content & frequency you're looking for this Fall. And if you don't feel comfortable doing that, go ahead and send me an e-mail with your thoughts.

September 03, 2009

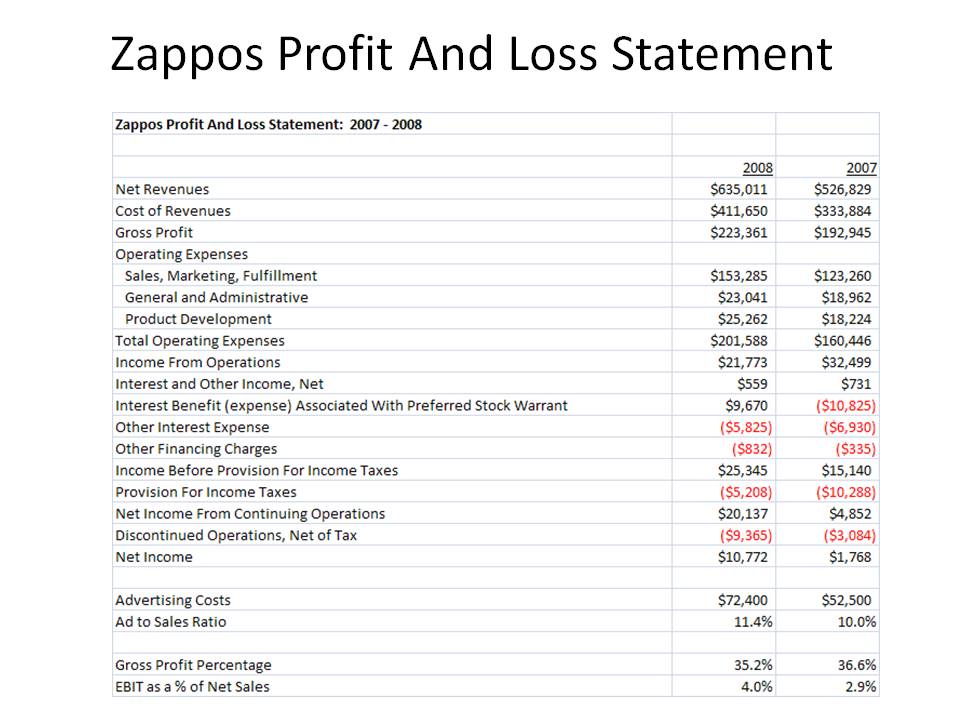
Zappos Profit And Loss Statement: 2007 - 2008

Thanks to a tweet from @manross on Twitter, I found the Zappos 2007-2008 profit and loss statement buried deep within documentation from Amazon.com.


Highlights:

Net Sales of $635 million in 2008. If quoted gross sales of a billion are accurate, then the return rate is more than thirty percent, pretty typical for footwear, but crippling to a profit and loss statement.

Gross Profit percentage is about 35%.

Advertising Expense was $72 million in 2008, about 11.4% of net sales. For my catalog audience, pay close attention to this number --- it is far greater than your typical online marketing / advertising percentage, but is far less than the percentage of sales you're spending on catalog marketing. Long-term, the catalog industry will have to become significantly more efficient.

Profit Flow-Through, after backing out advertising and G&A expense is 19%. You can run a profitable business with a 10% or 15% flow-through, but you need tremendous volume and a high level of operational efficiency. Conversely, most businesses I work with (many selling the same product that Zappos sells) generate 25% to 40% flow-through rates. Because Zappos has a comparatively low gross margin rate, they must generate significant sales volume without the aid of any advertising in order to cover this very low flow-through rate. To me, this one metric is the most disappointing thing I've seen in the Zappos business model.

Pre-Tax Profit is 4%, and was 3% the year prior, far lower than what would be posted by a healthy shoe and/or apparel business. Granted, Zappos is early in the life of their business. The low flow-through rate destines Zappos to have mediocre pre-tax profit rates.

All that being said, Zappos is still clearly a success. Because of Amazon's purchase, we finally get to see the warts, and all of our businesses have warts, don't they?

Time for your thoughts. How does the Zappos p&l stack up against your business?

Catalog Choice: Affiliate Program

What are your thoughts about Catalog Choice entering affiliate marketing?

Most of my clients carefully analyze affiliate marketing relationships, and thoroughly understand the new customer / existing customer issue with affiliates. Hint: It's a good thing if you get at least 80% of your affiliate marketing business from new customers.

I mentioned to several people this week that 2009 is the most interesting year I've seen in Catalog Marketing in the past decade. In so many ways, the industry has been in a decade-long "multichannel" fog that is finally being exposed for not delivering unfettered profits. Business models are being dismantled, unpredictable alliances are emerging, and a deep split is forming between catalog tradition and survival/adaptation.

Where do you think the catalog industry is heading?

September 02, 2009

OMS: PPC And Retail

You've probably been paying attention to the stuff that George Michie has been writing about on the Rimm-Kaufman blog.

Pay attention to his work, folks. It's always fun when the results don't match up with conventional thinking, that's the only way we learn!

The fun part about his research is that it helps you optimize and improve your business. This is great stuff for the online marketer and web analytics expert.

Over here in Online Marketing Simulation (OMS) land, we like web analytics and we like online marketing. But we don't compete with web analytics and online marketing, do we? No, we complement web analytics and online marketing by helping CEOs answer one important question ... "what happens next?"

In other words, you are a retailer, and you just acquired a customer via search. Will this customer shop in your store in the future?

Let's go to the OMS to find out.

A typical outcome looks like this, for a segment of newly acquired search customers:

  • Year 1 Search = $70,000. Year 1 Retail = $130,000.
  • Year 2 Search = $60,000. Year 2 Retail = $170,000.
  • Year 5 Search = $40,000. Year 5 Retail = $140,000.

Notice that most of the future value happens in a retail store.

Your mileage will vary. At Nordstrom, we used Multichannel Forensics, the precursor to the OMS, to learn several years ago that every dollar we saw in search today was paired with another future dollar in retail stores.

This meant that we could dramatically increase the search budget. If you're an online marketer, you like it when your budget is increased because somebody proved that you are adding value not captured in your web analytics software package.

Use online marketing and web analytics to understand what is happening today.

Use the OMS, the Online Marketing Simulation (my version, or the one you create), to understand what is going to happen tomorrow. Once you know what is going to happen tomorrow, you can significantly change your budget levels today!

September 01, 2009

Gliebers Dresses: ROI Accountability

The first Executive Meeting in several weeks is about to begin.

Glenn Glieber (Owner): "... this is the amazing thing about listening to customer calls in the call center. This woman wanted a 'Labor Day discount'. Who ever heard of that? The caller says that Anna Carter is offering a 'Labor Day discount'. I didn't realize that we're supposed to make less profit just because Labor Day weekend is coming."

Meredith Thompson (Merchandising): "Kevin, is that you?"

Kevin: "Yup, it's me!"

Glenn Glieber: "I want to use today's meeting to review the role each one of us has played in generating profit for our company this year. Let's start with you, Meredith."

Meredith Thompson: "As you know, our new products are really working well. During an average year, new products generate $220,000 of profit, prior to accounting for fixed costs. This year, new products have been a surprise, generating $825,000 of profit prior to accounting for fixed costs. This yields an incremental $605,000 of profit. Our inventory team has done an amazing job buying just the right amount of merchandise. Gross Margins are predicted to be 2% better than last year, adding another $800,000 of profit. In total, we believe we've added more than $1.4 million in profit during a down economy."

Roger Morgan (IT and Operations): "My contact center and distribution center team have managed expenses in a fantastic manner this year, generating an incremental $275,000 profit compared to our expense structure last year. My IT team is responsible for website programming code that saved $125,000 in expense compared with last year. In total, we a projecting an annualized $400,000 of incremental expense savings, compared with last year."

Lois Gladstone (Chief Financial Officer): "We believe our loyalty program, once annualized, with generate close to a half-million dollars of profit, if not more, due to increased loyalty. Maybe best of all, however, is that we partnered with Candi Layton in HR to move our health care plan to a cheaper plan, one that will save the company $625,000 this year."

Pepper Morgan (Interim Chief Marketing Officer): "Boris Feldman made changes to how we select names for catalog mailings, adding $320,000 of annual profit. Spike Spencer, our Web Analytics guru, tested many combinations of landing pages, increasing conversion rates by a half point, adding $200,000 of annual profit. And our work with Kevin on optimizing the contact strategy will yield close to $1,000,000 of annual profit. All told, marketing is expected to contribute an annualized incremental total of $1,520,000 profit."

Candi Layton (Chief Customer Officer and HR): "Our HR efforts speak for themselves. We helped Sarah Wheldon hire Spike Spencer, so we share in the $200,000 of annual profit that he helped generate. We shared in the hiring of three new buyers in merchandising, buyers that generated more than $600,000 of incremental profit. And we pushed through a new health insurance plan with finance, generating more than $600,000 in incremental profit."

Meredith Thompson: "Candi, how about social media? How much incremental profit are your social media activities expected to generate this year?"

Candi Layton: "Oh goodness. Social media experts out in the blogosphere and on Twitter tell us that you don't measure social media on sales and profit, you measure it by the quality of the conversation."

Meredith Thompson: "Seriously?"

Candi Layton: "Absolutely. You cannot hold this social media stuff to the same lame metrics that other departments are held to."

Lois Gladstone: "You mean sales and profit?"

Candi Layton: "Yes, Lois! Social media cannot be held to metrics like sales and profit. It's about a conversation, it is about relationships, it is about listening. That's why we call our social media efforts 'Gliebers Listens'. We certainly don't call it 'Gliebers Extracts Profit From You'".

Roger Morgan: "Candi, do you understand that the rest of us are held accountable for either generating sales, increasing profit, or reducing expenses? The only way we get to keep our job is if we make incremental improvements, every single year."

Candi Layton: "But social media is different, Roger. We're making an investment in the future. If we don't invest in the future, there is no future. Certainly, you understand that, don't you Roger?"

Pepper Morgan: "We do that in marketing, Candi. We willingly lose money in our pay-per-click efforts. We know that we'll lose $5 per new customer in pay-per-click, and that's ok, because we'll make $20 of profit in the next twelve months. We lose five today to make twenty tomorrow."

Lois Gladstone: "So in your case, Candi, we're paying half of your salary and one full time salary in your department to shepherd our social media efforts. We're investing $200,000 in salary and benefits this year for our social media activities. Show us what we get in return of that investment?"

Candi Layton: "I really think all of you are fundamentally wrong. You don't measure social media by saying that we'll get $300,000 of profit for our $200,000 investment. You listen to customers and react to their requests. We currently have 18,000 followers on Twitter. We're making a difference. If our followers knew that we were hoping to extract profit from them, they wouldn't follow us. Then what would we have?"

Meredith Thompson: "Candi, it is our job to extract profit from customers. If we don't do that, we don't have jobs. You have to be held accountable to the same set of standards that the rest of us are held accountable to."

Candi Layton: "No Meredith, it is our job to build relationships with customers. And if we build quality relationships with customers, deep relationships that show that we listen, then profit will follow.

Meredith Thompson: "Prove it. If each of us are going to lose money on something, we have to demonstrate that the cumulative impact of our activities will be profitable."

Candi Layton: "I don't have to prove it. I can take it on faith. Meredith, you don't know when you introduce a new product that the new product will ever be profitable. We all have to have faith that you will mysteriously identify the products that customers love. We trust you. Why don't you trust social media?"

Meredith Thompson: "I have the metrics to demonstrate that, over the past twenty years, 27% of my new products will be successful, 73% will be failures. I have the metrics to demonstrate that the profit from new products will greatly outpace the money we lose on the failures. Pepper has similar metrics. Roger has similar metrics. Lois has similar metrics. Now what are your metrics, Candi?"

Candi Layton: "You don't measure listening, Meredith. You don't measure relationships, Meredith."

Roger Morgan: "We do put a dollar value on relationships and listening. We measure every call center employee based on average order value. We know that we have six or seven employees who consistently deliver better-than-average order sizes, and we compensate those individuals far better as a result of the contribution they make to the company."

Pepper Morgan: "Kevin, can you help Candi out?"

Kevin: "Certainly! Candi, you told me that you heard ideas for three new products on Twitter, is that right?"

Candi Layton: "Yes, Meredith agreed to develop three new products based on feedback on Twitter."

Kevin: "Good, let's track the performance of the new products next spring. If those products perform better than the average new product, then Candi gets credit for it, because she listened to customer feedback on Twitter."

Pepper Morgan: "What else?"

Kevin: "Take partial credit for every single customer service issue you solve on Twitter. We know that each Gliebers Dresses customer generates $40 profit per year. If you solve a customer problem, take credit for half of that total, until we get better metrics to understand the impact of customer service via Twitter. If you solve a thousand problems a year, you get credit for $20,000."

Lois Gladstone: "Candi, didn't we listen to some customers who didn't want to receive catalogs anymore, and take them off the mailing list?"

Kevin: "You did, you took 800 customers off of the mailing list. Those customers received an average of 12 mailings a year, 9,600 total, saving another $7,000. You see, we just thought of a handful of issues sitting here talking. Now go back to the drawing board, and measure EVERYTHING! Think about how every single interaction you have on Twitter contributes to the sales and profit of your company. Say you find that you're generating $400,000 of profit a year, and you are spending $200,000 to support social media initiatives. This means you are generating $200,000 of incremental profit. Give Glenn half of that money, and then spend another $100,000 hiring another social media expert. Allow your social media efforts to self-fund themselves. But the key to this is to MEASURE EVERYTHING."

Meredith Thompson: "I agree. Every one of us is responsible, is held accountable, to generating incremental profit. It is time for social media to be held accountable, too."

Candi Layton: "To a point, folks. I think if we hold social media to the level of accountability that we hold everybody else to, then we lose a certain amount of authenticity, and our efforts are then destined to fail."

Lois Gladstone: "Or we can choose to not invest in social media at all, if we cannot demonstrate a return on investment."

Candi Layton: "And then our competitors gain an advantage over us. We don't need that, do we? I mean, at what point do we acknowledge that social media is a lot like research and development? R&D folks are held accountable to a different set of standards, aren't they?"

Meredith Thompson: "There is some truth to that. However, it simply cannot be a case where we all work hard, fighting for our jobs, while you and 20,000 followers pontificate about our Luddite attitudes. You get to punch the clock on the profit that we generate for your job, allowing you to tell us how stupid we are."

Glenn Glieber: "Spirited conversation, thanks everybody! Ok, on to the next topic. Telephone sales are down another 10% this month. This is going to require at least a 10% reduction in workforce in the call center. Roger, please prepare a plan for me to reduce call center jobs. I know this will be painful, but we don't have the phone orders necessary to fund these jobs anymore."

Content Creation

Here's the link . I realize many of you are stymied by creating content for your customers. Some of you would say the video above is poi...