February 09, 2022

Business Stages

The Start Up:  I typically view e-commerce brands with annual sales between $1 and $10,000,000 as being in startup mode. These businesses frequently lose money, but are surprisingly good at customer acquisition - generating word of mouth that results in low-cost / no-cost new customers. These businesses typically have a small merchandise assortment, with customers being a fan of a small number of items.

$10,000,000 - $30,000,000:  Things change here. The free flow of new customers comes to an end. The company needs to spend money to find new customers, and the return on investment isn't all that bad. The merchandise assortment begins to grow as somebody at the company figures out that average order values increase as the size of the assortment increases. Merchandise productivity increases due to the increase in the assortment.

$30,000,000 - $100,000,000:  Now we have trouble. Customer acquisition becomes ever-more expensive. The brand learns that there is a law of diminishing returns ... spend more, get more, but at an ever-decreasing rate. The easy growth associated with increasing the size of the merchandising assortment comes to an end as well. The company realizes that the Management Team that took the company through two very difficult stages may not be the team that takes this company north of $100,000,000. From a math standpoint, the customer acquisition program is "optimized" according to the numbers folks - and by optimized, I mean that the company cannot spend more money without a significant drain on the profit and loss statement.

$100,000,000 - $500,000,000: The company becomes a "brand". It has to become a brand to stand for something. Whereas the products sold were the "brand" before the company hit $30,000,000 in sales, now the company becomes a brand in an effort to sell more. When the company cracks the code (think about Duluth Trading Company a decade ago), merchandise productivity skyrockets, causing the p&l to leverage favorably. The company can reinvest money in advertising that works, allowing for more new customers and rapid growth.

After $500,000,000: The "brand lift" eventually quiets down. This is the point where bureaucracy takes over. The gifted, growth-oriented individuals are moved aside as the core business is fully optimized for profit generation. The business will peak, for a fully optimized business really can't grow because it would not longer be optimized, correct? All it takes is a modest drop in merchandise productivity, a drop that is inevitable, for panic to set in. How the brand handles this first major drop in merchandise productivity determines how long the business can remain strong.

Contraction: When I have demographic data at my disposal, it is common to see a brand that has a customer base that ages 0.7 years for every year that passes. In other words, if the customer base was 35 years old in 2012, the customer base will be 42 years old in 2022. Eventually the "brand" disconnects from younger generations ... why would a 24 year old want to buy merchandise that caters to a 54 year old? You'll know that the disconnect is in full force when your merchandise productivity is flat or increasing and you cannot simultaneously acquire enough new customers to meet your sales objectives. It's not uncommon for a mature brand in contraction to create a spinoff that provides a path to the future ... J. Crew's Madewell comes to mind. A business in contraction is well served by birthing predecessors. Too often, Management takes the opposite approach - trying to reinvent the core brand. That approach "can" work, but it is hard work, folks. The alternative (birthing predecessor brands) is equally hard work.

Each business stage requires different approaches ... approaches often derived from new Management teams brought in to push the company over each hurdle. If your "brand" is stalled, it might be time to think about the next business stage.

February 08, 2022

Better Merchandise - More New Customers

I shared this relationship with you a few days ago.


On the x-axis you have Merchandise Productivity. If it were 10% better than it is today, customer acquisition efforts would be executed at a break-even level.

The graph shows that, instead, the company is losing $4.00 profit for every customer the company acquires.

And if Merchandise Productivity slumps another 10%, profit per new customer slumps to about a loss of $7.50 per new customer.

If your company loses $4.00 for every one of 100,000 new customers, you're out $400,000. If Merchandise Productivity improves, you pocket $400,000 additional dollars of profit ... which you can invest in more new customers (or you can pocket it), which then fuels more growth and profit in the future.

When your merchandising team succeeds, marketing succeeds, you have more new customers, and the whole machine runs more efficiently.

February 07, 2022

Customers Like Their Price Bands

Here I segmented customers based on the average price they paid for merchandise in the past.

Then I measured the fraction of next year's sales that were generated by price band.

Tell me what you see when you look at this table.


Yeah, that one is easy to interpret, isn't it?

Customers who bought low-priced items in the past buy low-priced items in the future.

Customers who bought expensive items in the past buy expensive items in the future.

So what do you think is happening to your business as inflation causes your cost of goods to increase, causing you to increase prices?

Well, those who are participating in The MineThatData Elite Program will know the answer after their run is completed at the end of the month! How about you? For just $1,800 you can find out the answer. Contact me (kevinh@minethatdata.com) for details.


February 06, 2022

Why Do I Always Mention It?

I've been talking about Merchandise Productivity for the past decade. Over and over again. Written booklets about it.

A typical question received sounds like this:  "I'm a marketer, merchandise shouldn't matter to me, should it?"

It should.

Let's pretend you spend $1,000 on marketing, and your profit factor is 35%. You generate $3,700 in sales. How much profit do you generate?  $3,700*0.35 - $1,000 = $295.

Now let's pretend that merchandise productivity decreases by 10%. What happens to profit?  $3,700*(1-0.10)*0.35 - $1,000 = $165. Oh oh.

Let's pretend that merchandise productivity decreases by 25%. What happens to profit? $3,700*(1-0.25)*0.35 - $1,000 = ($29).

So in a situation where your merchandising team does a lousy job, are you accountable for seeing a profit of $295 turn into a loss of $29? Is that on you? Or is that on your merchandising team?

You know the correct answer.

So why do you go to work every day and get barked at by Management for failing to achieve the goals set out for you at the start of the year?

I always mention Merchandise Productivity because you (most of you reading this are in Marketing or Management) should not be held accountable for product challenges. You should be held accountable for generating enough new customers to fuel the success of your brand (after accounting for Merchandise Productivity).

February 03, 2022

Delayed Impact

When a business is stuck, you witness the slow death of the customer file. Here's an example.

No bueno. This business is going nowhere fast!

Let's assume that we have a burst in new customers, from 462,682 in Year 1 to 600,000. What happens to the customer file over time?

Let's look at the top segment ... 12 month existing 3x+ (3+ orders in the past year). This is what the trajectory looked like.
  • Year 0 = 88,437.
  • Year 1 = 86,789.
  • Year 2 = 84,379.
  • Year 3 = 82,679.
  • Year 4 = 81,411.
  • Year 5 = 80,577.
And this is what it looks like with a major bump in new customers.
  • Year 0 = 88,437.
  • Year 1 = 86,789.
  • Year 2 = 91,067.
  • Year 3 = 86,966.
  • Year 4 = 84,960.
  • Year 5 = 83,170.
Here's the difference by year.
  • Year 0 = 0.
  • Year 1 = 0.
  • Year 2 = 6,688.
  • Year 3 = 4,287.
  • Year 4 = 3,549.
  • Year 5 = 2,593.
The payoff comes downstream. You acquire a lot more customers today, and in years two through five you have more outstanding customers who deliver disproportionate profit. There's a delayed impact at the top of the file.

If you want loyal customers tomorrow, acquire more customers today.


February 02, 2022

Customer Development and Profit

Let's introduce a term you've heard me mention numerous times ... "Profit Factor".

The term "Profit Factor" represents the fraction of sales that flow-through to profit, prior to subtracting ad cost and fixed costs.

For instance, assume that your gross margin is 52% of sales, and that 10% of sales are consumed by picking / packing / shipping an item. Your "Profit Factor" is 42%.

When evaluating marketing effectiveness, we do not consider fixed costs. Fixed costs are "fixed" ... they don't change as marketing effectiveness or ad spend changes.

With that knowledge in the bank, let's think about how Customer Development and Profit are linked together.

It begins with Customer Acquisition. Let's say that you purchase 1,000 keywords at $0.65 each. 2% of the clicks convert to a purchase, spending $70 each. Assume your profit factor is 42%. How much profit did you generate? And how much profit was generated per response?

  • Clicks = 1,000.
  • Conversion Rate = 2%. Conversions = 1,000 * 0.02 = 20.
  • AOV = $70. Sales = 20*$70 = $1,400.
  • Profit Factor = 42%. Ad Cost = $0.65*1,000 = $650. 
  • Profit prior to ad costs = $1,400*0.42 - $650 = $588 - $650 = ($62).
  • Profit per Response = ($62) / 20 = ($3.10).
This company lost $3.10 per response (new customer). This company will have to make up the difference downstream and then some in order for the company to be successful.

Let's now assume that merchandise productivity drops by 10%. This kind of thing happens all the time. This manifests itself via conversion rates ... instead of a 2% conversion rate we now have a 1.8% conversion rate. Watch how the math changes.

  • Clicks = 1,000.
  • Conversion Rate = 1.8%. Conversions = 1,000 * 0.018 = 18.
  • AOV = $70. Sales = 18*$70 = $1,260.
  • Profit Factor = 42%. Ad Cost = $0.65*1,000 = $650. 
  • Profit prior to ad costs = $1,260*0.42 - $529.20 = $529.20- $650 = ($120.80).
  • Profit per Response = ($120.80) / 18 = ($6.71).
The marketer hasn't done anything different. The marketing landscape isn't different. But customers like your merchandise 10% less than they did a year ago and this results in a Profit per Response of ($6.71) vs ($3.10) otherwise.

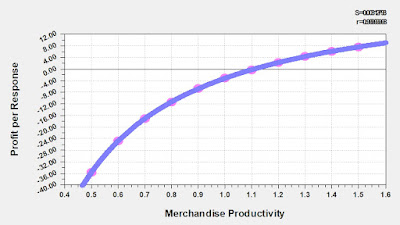
We can simulate the outcome at merchandise productivity of half of prior year, through 1.5 times as good as prior year, as depicted below.


Currently, this company is losing money via the keywords they are buying. But if merchandise productivity improves by 10%, the company approaches break-even. If merchandise productivity improves by 20%, the company is making $2.32 per response.

Look at what happens as merchandise productivity erodes.

Profit per Response gets progressively worse, and the rate that it gets worse accelerates.

It's common for companies to think that it is too expensive to acquire new customers ... this is happening a lot post-lockdown. But what has also happened post-lockdown is that merchandise productivity is down, and that drives down profit per response.

Honestly, some companies don't have a customer acquisition problem. They have a merchandise productivity problem that is measured via lousy customer acquisition metrics.

Customer Development and Profit are directly linked to each other. Both are influenced by Merchandise Productivity. When customers love your merchandise, you generate more profit and it is easier to develop existing customers (or find new customers). When customers aren't fond of your merchandise, merchandise productivity suffers, you are less profitable, and your customer acquisition metrics look bad ... and it becomes harder to develop customers.

Always measure Profit per Response.

Always adjust Profit per Response for Merchandise Productivity. If, after adjusting for Merchandise Productivity you find that Profit per Response is similar, then your customer acquisition activities are stable.


February 01, 2022

How One Marketing Director Fought Back

The worst matchup in the marketing / finance battle is a marketing director who is bad at math fighting against a CFO who is good at math. This matchup happens all the time, it is a one-sided matchup, and it is one of the reasons that marketing leadership is sent packing every-other-year.

The best matchup in the marketing / finance battle is a former accountant who now runs marketing, fighting against a CFO who is good at math.

Every time the CFO went after this individual, the individual came armed and ready for a battle. And oh my goodness were those battles exciting. I was there for them, in person. The Marketing Director went after everybody who didn't possess the title of "CFO".

  • "Why are we featuring an item on the home page that has a 44% return rate? We're losing money on every one of these widgets. Stop it!!"
  • "Your gross margin on this widget is 19%. Why would we do that? Are we stupid? This widget is responsible for 2% of your sales and we can barely mark the item up because of pricing pressure? Why would we even sell the item?"
  • "This item sells at half the rate it sold at two years ago. Is anybody in merchandising even paying attention anymore?"
  • "Why did the inventory team buy 50% more widgets when we have no proven track record of selling more widgets? Are they stupid? Now we have to sell all this garbage at 50% off, and I'm being told to reduce marketing spend as a consequence. Why can't the inventory team wake up and behave in a rational manner?"
  • "Why is creative constantly rolling out Haley as a model? When Haley wears our stuff the productivity of the items drops by 30%. We all know this. So why do we keep doing it? Can somebody explain it to me in language a seven year old would understand?"
This marketing director would go into meetings with much higher paid Executives and just drop facts all over the room. The marketing director would go on the offensive, go after "low hanging fruit".

The marketing director figured out that the key to success was manipulating the "Profit Factor". If she could increase the profit factor by 2.5 points, earnings before taxes would dramatically increase. So she'd do all the research. She knew which items impacted the profit factor most. She knew that return rates were critical. She knew that gross margins were critical. She knew that creative strategy impacted merchandise productivity.

She wasn't dumb.

She wasn't exactly kind, either.

But she got things done.

And she deflected all of the horrible comments away from the Marketing team, a team that didn't deserve the static they received.

I was there, I watched it happen.

It was amazing!

On Twitter, I asked readers what percentage of marketers know which items were among the top 100 sellers at their company. The respondent could choose between 0%, 15%, 45%, and 85%. Almost all answers were 0% or 15%. In other words, readers knew that marketers do not understand what sells. And if the marketer has no idea what sells, how can the marketer even market to the customer in the first place?

Borrow the strategy used by the Marketing Director mentioned above. You don't have to be nasty about pointing out flaws, be kind instead. But by all means, realize that if your CFO is demanding that you become more profitable, focus attention on all of the little pieces of the puzzle that yield more profit ... and shift accountability toward those who evade accountability.

Content Creation

Here's the link . I realize many of you are stymied by creating content for your customers. Some of you would say the video above is poi...