April 11, 2017

Multiple Stores in a Market

When there are multiple stores in a market, the case for closing an under-performing store increases. Why?

Well, when there are five stores in a market and you close one store, retail sales are less likely to simply disappear. It's much more common for half of the sales to reallocate to existing stores, while some of the sales reallocate to the online channel.

The Market-Level Profit-And-Loss Statement looks something like this.


The $800,000 store is generating $300,000 of true incremental net sales value - and is in reality a wildly unprofitable store.

So again, this prompts discussions at an Executive Level.
  • Can we defend generating $300,000 of incremental sales that lose $84,000 profit?
In our modern world, there are more experts who would defend $300,000 of sales that lose $84,000 then there are financial folks who are there to defend company profitability.

In most cases, Executives / Directors / Managers earn annual bonuses dependent upon net sales increases and earnings before taxes increases. There is literally an equation that helps the Executive make this decision.

Forecasting becomes critically important. If we forecast retail sales to continue to decline, then the exercise becomes irrelevant - the store needs to be closed.

Smart retailers have market-level profit-and-loss statements for every market. They hire analytics gurus to forecast what will happen in the future, and the analytics gurus figure out what is likely to happen in the future if a store is closed. Again, forecasting becomes critically important. Without credible forecasts, there's just a lot of shouting and thought leadership.

Contact me (kevinh@minethatdata.com) for your own forecasting solution.


April 10, 2017

Market-Level Profit and Loss Statements

Remember this (click here)?

That was a case where a store was closed, and online sales did not increase. When the store closed, customers simply went elsewhere. The market lost nearly half of the sales that existed when the store was there.

Now, if you look at top-line sales and care about sales growth, that's a problem.

If you are a CFO and care about profitability, you don't care one bit about that as long as profit increases.

This is where market-level profit and loss statements come into play. Smart retailers have market-level profit-and-loss statements for every market, based on forecasts for what happens when a store closes.

Here is an example in a market where there is just one store. When the store closes, the market is forecast to become more profitable.

The incremental value of the store in the market is negative. The store generates $640,000 of in-store retail sales. The store actually suppresses $200,000 of online sales. And in total, the store loses $19,200 profit.

Catalogers went through this process 10-15 years ago. Catalogers produced profit-and-loss statements for individual catalogs, using mail/holdout tests, determining whether catalogs truly added value or not. We did this at Nordstrom. We knew that catalogs were break-even propositions in terms of incremental value. Catalogs were killed. Game over. Customers didn't care. Profit actually increased.

Smart retailers have market-level profit and loss statements ... for every market (often for individual store trade areas). They know what needs to be done.

At an Executive Level, the discussions become interesting.
  • Does the "brand" need to produce $440,000 of net sales that generate a loss of $19,200?
The room rapidly splits into two camps.
  • Market-Share and Growth advocates immediately say "YES". They lobby to keep the store open (we can't shrink our way to growth - the loss is a small price to pay to protect the brand).
  • Profit advocates immediately say "NO" (there is no reason to run a business that generates sales at a loss, if you believe that is the right decision, why not take a pay cut).
The analytical guru typically creates a scenario illustrating what it takes for the store to generate positive incremental profit. Look at the scenario below.

The "market" needs a 20% increase in merchandise productivity in order for the store to generate incremental profit ... and even then, the store is generating $8,960 profit on sales of $528,000.

We all know that merchandise productivity is not going to increase by 20% ... that hasn't happened in more than twenty years (pre-internet), right?

This is why stores are closing, my friends. Market-Level Profit-And-Loss Statements coupled with forecasts for future retail cannibalization and future merchandise productivity indicate what is best for the market in question.

Forecasting skills have become critically important in modern analytics.

Market-Level Profit-And-Loss Statements have become critically important in modern retailing.

Give me a holler (kevinh@minethatdata.com) if you need help with forecasting and market-level profit and loss statements.

April 09, 2017

What Happens To Online Sales When A Store Closes?

If you are a retail brand, you actively measure what happens when a store closes.

Every market is different, of course. Closing a store in a market with six existing stores is very different than closing a store in market 400 miles from the next-nearest store.

Here's a case of "the latter" courtesy of a recent project.

Annual Sales Change At Time Of Closure:
  • Online = +6%.
  • Total Retail = -5%.
  • Total Sales = -0%.
This store was a victim of online cannibalization ... a decade of online gains and retail losses yielded a market with no sales change and a dying store. Management decided to close the store.

One Year Later:
  • Online = +8%.
  • Total Retail = -93%.
  • Total Sales = -48%.
Look at that. Online grew at historical rates ... sales didn't just shift over, did they? And because there isn't another store nearby, total retail sales dried up. Sales in the market were cut in half.

Two Years Later:
  • Online = +6%.
  • Total Retail = +30% (on a very tiny base).
  • Total Sales = +8%.
Now look at this one.

Three Years Later:
  • Online = -6%.
  • Total Retail = +9%.
  • Total Sales = -4%.
Without the store in the market to feed customers to the online channel, we observe that the online channel loses sales. A brief increase is followed by slowing growth and then a sales decline.

Friends, please analyze the living daylights out of this dynamic. As Traditional Retail implodes, stores are going to close. This does not mean that your online channel will increase even more. Too often, the reason the online channel grows is because the retail store does a good job of recruiting customers. Take away new customers from retail stores, and you take away future online sales growth.

P.S.: If you need help measuring this dynamic, please, give me a holler (kevinh@minethatdata.com).

April 06, 2017

A Stunning Strategy Leads To A Winner!!

Here were the results after year one.


And after year two.


And after year three.


And after year four.


Ready for the final year ... and our winner??


Look at that!

Look at what Widgwon did to win the whole darn thing!!

  • Reduced the ad-to-sales ratio.
  • Greatly increased Widget pricing.
  • Greatly increased Bidget pricing.
  • Left Tidget pricing at average levels.
  • Kept discounting low.
Now, Widgwon didn't sell many Widgets or Bidgets ... but at a 76% gross margin level, they sold enough to nearly double the average level of profit and win the whole thing!!

In other words, Widgwon tried a unique strategy that nobody else tried ... and their strategy resulted in the win!!!

I ran a scenario where Widgwon did not change strategy ... that would have been a bad thing for Widgwon but a good thing for Pickaxe, who came in second but would have won otherwise.  Pickaxe made a late run for the title by making numerous changes.
  • Reducing ad-to-sales ratio.
  • Moving staff offline.
  • Shifting the marketing budget to equal online/offline.
  • Increasing prices.
  • Increasing the percentage off.
Their sales declined, but profit increased nicely, leaving Pickaxe in second place.

Awards were also given to teams that had the best total sales levels in year five by product category.
  • Widgets = Pickaxe.
  • Bidgets = Pickaxers.
  • Tidgets = Pickaxers.
PIckaxers were never in the running for the title ... but instead optimized their business to sell the most Bidgets/Tidgets by offering the lowest prices and allocating staff online.

Most important - of course - is the fact that all twenty teams were able to optimize overall average business performance over five years, even though the teams were given highly incomplete and correlated metrics.
  • Gross margins increased from 55% to 59%.
  • Ad-To-Sales ratios dropped from 22% to 15%.
  • Staffing levels generally didn't change much.
  • Prices increased over time.
  • Discounts/Promotions increased over time.
  • Shipping/Handling modestly shifted to free shipping 24/7/365 over time.
  • Earnings Before Taxes increased from 17% to 27% over time.
That's the point I wanted to make in this two-hour exercise.

With sub-optimal metrics, the teams were able to consistently improve financial metrics over time. 

With only five minutes to make decisions between rounds (not nearly enough time), the teams were able to consistently make good decisions.

Think about this for a moment.

With bad data and no time to make decisions, two-hundred earnest professionals were able to consistently make good decisions.

Now I get it ... this is just a business simulation, so it "doesn't mean anything". 

Of course it means "something"!!

It means that we, as business leaders, need to let staff make decisions.

It means that we, as business leaders, need to let staff make decisions faster.

It means that we, as business leaders, need to reward staff members who make mistakes and then change course quickly and then improve business results quickly.

It means that we don't have to wait for perfect data.

It means that we don't have to wait for perfect metrics.

I'm convinced that "we" are the problem ... we don't let our teams do their jobs. When a team runs tests that show that the organic percentage is 91% and we balk at their results, we hurt the business - why not give people a chance to see if their tactics work in the real world, reversing course if the tactics don't work?

I've learned that the more "traditional" the business is, the less likely the business is to let Managers/Directors make decisions. And the more "traditional" the business is, the less likely the business is to make decisions unless there is "proof" that the decision will be the "right" decision.

This means that I've learned that "traditional" businesses are killing themselves at the very time they need to be taking more risks. Our people are smart enough - even with highly incomplete data/metrics - to do the right thing.

So why aren't we letting our Managers/Directors do the right thing?

Interested in trying The MineThatData Academy Business Simulation? Give me a holler (kevinh@minethatdata.com).

P.S.:  Consider attending a VT/NH event in the future ... 

P.P.S.:  Two points to the two-hundred-plus attendees ... these people were "professionals" in every sense of the word. They spent money to attend, they were assigned to teams with people they didn't know, they collaborated, they had an open mind, they competed, and they were able to improve business performance with bad metrics and not nearly enough time to make decisions. Our business is in good hands if and only if we allow professionals to make decisions. Trust your Analysts, Managers, and Directors!

April 05, 2017

We Move Closer To An Overall Winner!!

The results after year one of The MineThatData Academy Business Simulation!

And then we have year two.

Followed by year three.

Teams made adjustments ... CEOs communicated their strategies to me ...


 ... leading to the results for year four.

Year Four Leaders:
  • Magnificent = $1.6 million.
  • Beanies = $1.6 million.
  • Name = $1.5 million.
  • Idgets(2) = $1.4 million.
  • Octagon = $1.4 million.
Just like that, we have two new entrants.
  • Magnificent got here by cutting back on marketing spend, by aligning marketing spend (online) with staffing (online), and by switching from paid shipping to free shipping with a hurdle. They also increased prices over time while offering 10% off.
  • Idgets(2) ... yes, there were two teams named Idgets ... got here by reducing ad spend while increasing prices and aligning staffing levels around online/mobile/social.
All twenty teams continued to make optimization improvements with marginal metrics at their disposal.
  • Gross Margins increased again.
  • Ad-To-Sales Ratios actually increased as teams searched for the right formula.
  • Staffing levels shifted even more online.
  • Prices increased significantly.
  • % off Promotions increased again (sort of like in the real world).
  • Free Shipping with a Hurdle.
Several teams were in the top five during the four year simulation run:
  • Magnificent = 1.
  • Pickaxe = 2.
  • Idgets(2) = 1.
  • Beanies = 3.
  • Name = 3.
  • Loopy = 2.
  • Octagon = 2.
  • WBT = 1.
  • Widgwon = 3.
  • Wiggies = 2.
So ten of the twenty teams managed to crack the top five at least once over four years. Don't be surprised if one of these teams wins the whole thing after year five!!

The teams sat down to determine final-round strategies.


Tomorrow, we reveal the winner!

Start thinking about how I might run a version of this simulation for your company, ok?

April 04, 2017

A Team Finally Cracks The Top Five As Strategies Evolve!!

Here's the results after year one:


And here are the results after year two:


One might think that Beanies would cruise to a victory. Not so. They spent a ton on marketing, however, their pricing strategy continued to be "more expensive" than other companies, and given the mix in strategies Beanies actually suffered a modest sales decline. Look at the results.


Let's look at the overall averages, because with only p&l style metrics, the audience was able to continue to optimize the business.

  • Gross Margins increased.
  • Ad-To-Sales Ratios decreased.
  • Staffing shifted modestly toward the Online channel.
  • Prices increased.
  • % Off Promotions increased.
  • One team dipped their toe into free shipping 24/7/365 (WBT).
Here are the leaders after year three:
  • Widgwon = $1.6 million.
  • Beanies = $1.5 million.
  • Pickaxe = $1.4 million.
  • Octagon = $1.4 million.
  • Wiggies = $1.3 mililon.
Octagon is a new entrant into the top five. Over the three year period, Octagon steadily increased prices, steadily increased promotional levels, shifted ad spend online, and shifted staffing levels online. They appear to have found a strategy that leads to success. Will their strategy continue to push them toward the top of the heap??

As you can see, teams really studied "the big board" to understand how different strategies impacted profitability.


Start thinking about how I might run a different version of this simulation for your company, ok?

More tomorrow.

April 03, 2017

After The First Year, Strategies Changed!

At the VT/NH event on March 30, two-hundred talented professionals competed for the coveted honor of winning the first ever MineThatData Academy Business Simulation!

Here were the results after year one.


Attendees checked "the big board", studying strategies and then making adjustments.


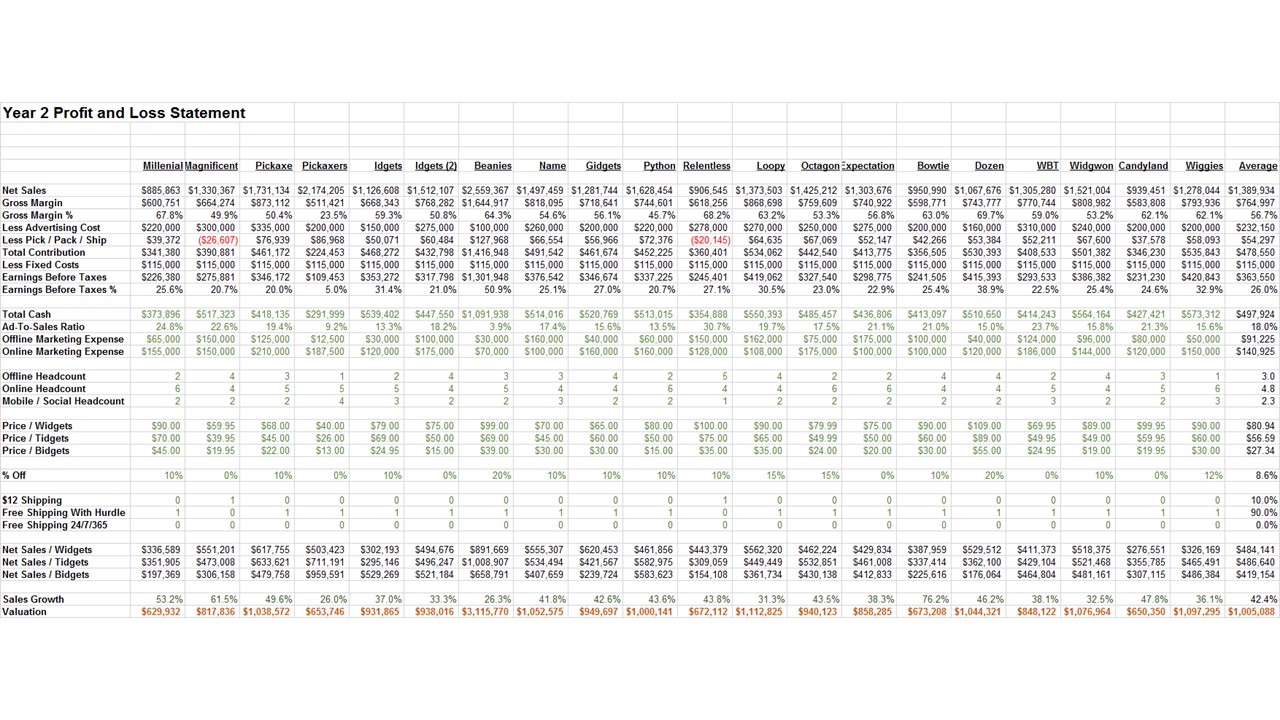
Twenty year-two strategies were submitted. Here are the results from year two.


Please click on the results, study them. What do you observe?
  • Teams increased overall gross margin percentages.
  • Ad-To-Sales Ratios marginally decreased (as teams tried to optimize marketing spend).
  • Teams did not fundamentally change staffing strategies.
  • Prices marginally increased.
  • Average percentage off increased from 6% to 9%.
  • Teams shifted marginally toward getting customers to pay for shipping.
Look at what "Beanies" did ... they leveraged very low prices in year one and actually lost money on their strategy ... then in year two, their high-level of sales carried over on more-than-expensive item prices, yielding a stunning valuation. In other words, they drove the top-line in year one, then optimized the business for profitability in year two (spending almost nothing on marketing), leading to a stunning level of sales/profit/valuation. They were the clear leader going into year three.

Year 2 Valuation:
  • Beanies = $3.1 million.
  • Loopy = $1.1 million.
  • Wiggies = $1.1 million.
  • Widgwon = $1.1 million.
  • Name = $1.1 million.
Notice that many of the leaders from year one are leaders from year two. Beanies leveraged a two-year strategy to bust into a dramatic lead. Clearly, somebody is going to have to do "something different" in order to make a run at the title!

The teams really noodled different solutions, didn't they?


Tomorrow, we look at year three.

Ready to compete, my friends? Start thinking about it.

Content Creation

Here's the link . I realize many of you are stymied by creating content for your customers. Some of you would say the video above is poi...