March 03, 2013

Work From Home

Maybe you heard ... there's a controversy out there about working from home (click here), and (click here) for a counter-argument.

This is one of those arguments where 95% of people can align and sound "right".  On the surface, they are right.  People should be allowed workplace flexibility, and employees should not be held to a "one size fits all policy".  

And on the surface, the 5% of employees who represent Management and align with Yahoo are "right" as well ... it is perfectly reasonable to expect that work-from-home staffers perform at the same level as the poor souls who are forced to trudge into work each and every day.  I used to manage 24 people, most of whom worked from home some of the time.  There were countless examples of folks doing great work, and folks taking advantage of me. I should have been allowed to expect everybody to give a fair effort, right?

This makes for great debate, it drives page views in trade journals and media outlets.  It's fantastic for Facebook and Twitter.

There isn't a right or wrong answer to this topic, just strongly worded opinions that do not make a difference.  We don't work at Yahoo, do we?  How could we possibly know if their choice is right or wrong for their unique circumstance with their unique employee base?  Imagine somebody from Yahoo waltzing into your office and beating up your corporate culture?  Who are they to know what's right for you and your company and your employees?

Have you ever listened to members of sport teams that win championships?  There are phrases that come up repeatedly.
  • "We have great team chemistry."
  • "We love each other."
How many of you feel this way about your co-workers?  Your boss?  Your CEO?  If you're in Management, do you feel this way about your team?

The issue isn't whether somebody is able to work from home or not.  The real issue is, of course, whether you can trust your employees/co-workers, and vice versa.  Because when people trust each other, there's the potential for team chemistry.  And when you have great team chemistry, all sorts of positive things can happen.

In a digital, sound-byte driven world where everybody gets to have an opinion, few people know how to foster great team chemistry, me included.

But if you do foster great team chemistry, you don't have to worry as much about policies and procedures.  Employees become accountable, they support each other.  The work, then, is more likely to be excellent, and the company more likely to thrive.

That's really what we're talking about ... how best to create a great culture, one where everybody trusts each other and performs at a high level, an accountable level.  Hard to solve that problem, no doubt.  But it is at the core of the work-from-home "conversation", and in an increasingly digital and less analog world, we seem uncomfortable to talk about it.

February 28, 2013

A Simple Look At New, Discontinued, and Carryover Merchandise

It's a simple table, really.

And yet, it tells us an amazing amount of information.

This is a business that is being killed by the merchandising team.

I like to look at what I call the "carryover ratio" ... comparing how carryover product performed last year, vs. two years ago.
  • 2011 Carryover Ratio = 74,382,048 / 87,443,297 = 85%.
  • 2012 Carryover Ratio = 69,483,920 / 86,854,900 = 80%.
The stuff the merchants decided to keep performed at 80% of prior year levels in 2012.  A year ago, the carryover ratio was 85%.  This tells us that what the merchandising team kept is dying at a faster rate than in the past.

Look at the number of newly introduced products, year-over-year.
  • 2011 = 845 items.
  • 2012 = 749 items.
Your merchandising team doesn't have enough new product in the pipeline.  Look at demand per item for new merchandise.
  • 2011 = 17,910,854 / 845 = $21,196.
  • 2012 = 14,559,047 / 749 = $19,438.
Not only did your merchandising team throttle new product development, the new items they introduced performed close to 10% worse than last year.

I also like to look at the ratio of new merchandise demand to discontinued merchandise demand.
  • 2011 Ratio = 17,910,854 / 4,772,277 = 3.75.
  • 2012 Ratio = 14,559,047 / 5,438,002 = 2.68.
New merchandise is not generating enough of a multiplier against discontinued merchandise.

These are easy metrics to acquire.  Go acquire them, analyze 'em, see if merchandise is your problem (hint, it usually is).

Barnes and Noble: #Omnichannel Fail?

You probably had an opportunity to review this little ditty from Barnes & Noble (click here).

A few questions for the omnichannel marketing community, a group that tells us that bricks 'n clicks and online and digital is far better than a single channel solution:

  1. Why would Amazon, with no retail, have a growing Kindle business, while B&N, with stores, be struggling?
  2. Why would B&N, with bricks 'n clicks and e-commerce and digital (Nook), be struggling, even after the top competitor (Borders) went out of business?
Barnes & Noble does what omnichannel experts love - bricks 'n clicks, e-commerce, and digital (Nook).  Retail competition was vacated when Borders failed.

And yet, B&N is struggling to compete with Amazon, a single-channel competitor.

On Twitter, I received this comment:
  • "It's not omnichannel's fault.  B&N was a sinking ship.  If anything, omnichannel is slowing down the sinking of the ship."
Why is it that when a business is doing well (say Macy's), we credit omnichannel for the success, but when a business is clearly failing in competition with a single-channel entity, we blame the victim?

Ok, time for your thoughts.  If total sales equate to 100% of a business, what % is caused by omnichannel?

February 27, 2013

New and Discontinued Merchandise

Each year, your merchandising team makes a series of decisions that impact the future health of your business.

Most of us fail to measure the impact of these decisions.

Let's go back to Nordstrom, circa 2003.  One of the better selling items in the catalog was the stirrup pant (click here).  Folks in the stores, however, hated these things ... simply unfashionable, and they got dinged when catalog customers returned the things in stores, because stores didn't carry comparable items.

By 2005, stirrup pants were no longer the scourge of the online division.  Even though the item sold well and paid for itself, the merchandising team made a strategic decision to no longer offer the item.

When your merchandising team decides to kill an item, they must replace the item with a new product.  Over time, new products must perform better than the items they replace.

Here's a homework assignment for you.
  1. Identify all items that your company sold in 2011.
  2. Identify all items that your company sold in 2012.
  3. Segment items into three groups ... offered in 2011 and 2012 ... offered in 2011 and discontinued in 2012 ... offered in 2012 but not in 2011.
  4. Measure total demand on carryover items ... items discontinued ... and items introduced.  Did carryover items perform better in 2012 than in 2011?  Did discontinued items perform better in 2011 than newly introduced items in 2012?
This simple analysis tells you a lot about the effectiveness of your merchandising team.

And if your business is in flux (growing fast or shrinking quickly), standardize your analysis.  Look only at customers with 2 purchases last year, then repeat steps 1-4 above, equalized per 1,000 customers.

February 26, 2013

Merchandise

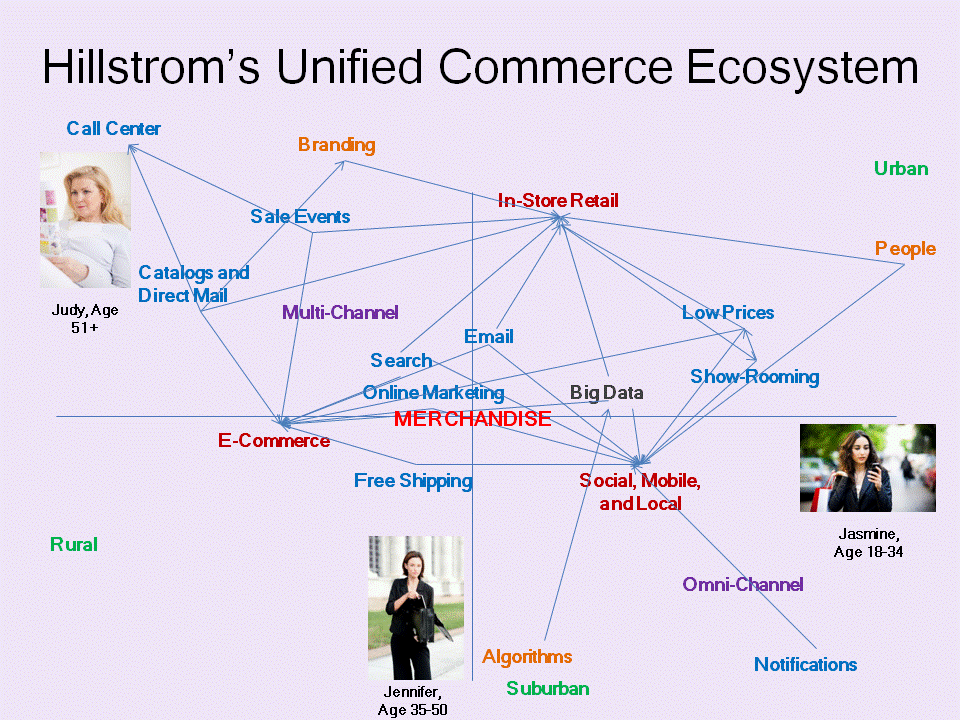
What is in the center of this ecosystem?

Merchandise!

In the past two years, my projects have taken a different direction.  You are asking me to understand customer behavior, no doubt, but you're increasingly asking me to illustrate the role that merchandise plays in driving channel behavior.


Not surprisingly, there's a unique relationship in merchandising that parallels the relationship observed in customer interaction with channels.  Not surprisingly, at least half of my projects identify a merchandise-related issue that is holding a business back.

It turns out that there are four key issues that tell me why a business is struggling.
  1. Sales performance of existing items.  When items tire, performance drops.  The ratio of this performance drop, over time, can tell us something about the future of a business.
  2. New items.  New items are comparable to new customers ... if your product development pipeline is failing, your business is failing.  This is the most common problem I see.
  3. New item performance vs. discontinued item performance.  When the ratio is decreasing (new items not performing well over time, discontinued items performing better over time), the business struggles.
  4. Disproportionate focus on a small number of high-performing items.  Think Apple, for a moment.  If the iPhone and iPad perform poorly, the whole thing craters.  It is common to see half of sales come from 5% of items.  This is risky, but it is reality.
Since merchandise trumps channels, it is important to analyze merchandise as vigorously as we analyze channels.

Can you even remember the last time you analyzed the four issues listed above?  If not, you have something to do tomorrow!

February 25, 2013

Co-Ops: A Must Read For Catalogers

With NEMOA just weeks away, we are reminded of the primary vehicle catalogers use to maintain sales ... co-ops!

A customer purchases online from a popular catalog brand.  This purchase, in accordance with the privacy policy, is passed along to various co-ops, in a relationship not unlike a farmer passing chickens to Land 'O Lakes for free in exchange for the future purchase of eggs.

The name/address, channel, and merchandise information is absorbed into "the cloud", where it is modeled, re-shaped, morphed, transformed, digitized, homogenized, pasteurized.  It's a recent, active purchaser from a catalog brand.  Catalogers love these names.  They rent them, for one-time use at +/- $0.06 each, from the co-ops.  

These days, it's not uncommon to see 75% of new catalog buyers sourced from co-ops.

Since the cataloger must receive a positive return on investment for giving co-ops access to assets for free, the co-ops do a credible job of rank-ordering names from best to worst.  The cataloger has a reasonable chance of acquiring new customers.


In the cataloger / co-op feedback loop, we churn the same names through the ecosystem, over and over and over again.  Sure, there are 100,000,000 households in the ecosystem, but the top 8% keep cycling through.  

Judy keeps cycling through the ecosystem.  Over and over and over again, at $0.06 a pop.

Jennifer does not cycle through as often.  Her purchases from non-catalog brands do not enter the ecosystem.  Her behavior is cycled through Google's complex adaptive system.  Or through the giant Amazon cumulonimbus cloud.

Jasmine barely interacts with the ecosystem.  Her friends' IDs are being shared with various companies that allow login via popular social networks, a whole different set of pros and cons to deal with.  Talk about a complex adaptive system - Jasmine logs in at some random site via Facebook and brings 229 of her BFFs along with her.

Our complex adaptive system is skewed to Judy.  We know this, because demographic data is appended to our customer data.  We actively measure the customers acquired from the co-ops, we know their age.  These customers aren't heavily skewed to those age 18-44, are they?

From the early 1990s to the early 2000s, the co-ops built their footprint, one company at a time.  Hard, hard work, on their behalf.  They earned their success. I remember the reps coming in to Lands' End and Eddie Bauer, selling the convenience and inexpensive nature of co-op modeling, begging for equal treatment in the merge/purge process.

From the early 2000s to the late 2000s, catalogers went all-in, destroying the list industry in the process.  I'm not sure whether that's a good thing or bad thing.  I will say that the brain drain that followed was awful.  Smart catalog brains fled to e-commerce, and today, mobile/social.  We traded decades of business knowledge for a peripheral knowledge about statistical models.

With the list industry in ruins, catalog prospecting and customer housefile management moved to the cloud.  Popular database companies maintain the existing customer relationship.  Co-ops (sometimes the same company) maintain the prospect customer relationship.  The cataloger barely owns the customer anymore.  If lucky, the catalog marketer forecasts sales per catalog, online sales, and the number of and content of marketing contacts.  We now know how to manage a process.  We don't know how to manage a customer relationship.

The complex adaptive catalog ecosystem does the rest.

The next part of the story should frighten catalog marketers.

The complex adaptive catalog ecosystem is spinning older and older names, self-optimizing itself to maximize the short-term, immediate profitability of the ecosystem.  We know this, because we measure the age of customers acquired from the co-ops.  It's common to see names that age 7 years for every 10 years that pass.

If the co-ops are spinning 58 year old names through the system today, they'll spin 65 year old names through the system in ten years.  Those people won't be customers anymore, they will be retirees.  The very system that generates short-term profit today is destined to deliver significant profit challenges in the future, if it keeps spinning older and older names at catalogers.

This goes well beyond what is happening in the cloud.  When the co-ops spin you a 50-69 year old customer, they spin you a customer that has specific merchandise preferences, preferences of a person age 50-69.  This means that certain items, and certain creative presentations, are going to work best in catalogs to a 50-69 year old audience, causing your merchandising team to misread trends.  Your merchants are reacting to the names the co-ops give you, not to the macro-economic trends that exist.  The items your merchants feature purposely lack appeal to an 18-44 year old customer, further shutting out the very audience that may preserve your future.  If you think I'm wrong, show your catalog to employees age 35 and younger, and ask them to judge the creative style and merchandise presentation of the catalog.  Their critique may not please you.

Unknowingly, your merchants and creative team are fueling the feedback loop.  They have no choice, do they?  In a data-driven world, they have to honor the data.  The data is driven by the customers you acquire.  The customers you acquire come from the co-ops.  The co-ops optimize around the most frequent catalog buyer.  That's a 55+ customer.

Some feedback loop, huh?

That's the world, as it exists today.  Overlay demographic data, and decide for yourself if I am accurate.

You cannot blame the co-ops for hyper-optimizing to a solution that ages your customer file.  That's their job.  You can blame the co-ops for not explaining to you what is happening.  Without you, they don't exist.  They have a responsibility to teach you the information I'm sharing with you today.

If this continues, the co-ops will run you out of business, and in the process, will destroy their own business model.

Fortunately, your future is not pre-determined.  You, the catalog executive, have the opportunity to use propulsion to eject yourself from the co-op feedback loop.  You, that's right, you get to determine if this continues. 

In the short-term, this will not be a profitable opportunity.  In the short-term, there will be pain.  In the short-term, the metrics will appear unfriendly, they will scream at you to run back to the comfort of the co-op feedback loop.

We made decisions that, in the short-term, made the most sense, that maximized short-term profitability.

In the next few years, it will be time to make decisions that are best for the long-term.

At NEMOA in a few weeks, have robust discussions about the feedback loop we're currently stuck in.  Print this article, and take it with you.  Have a real discussion with your vendor partners about your future.

February 24, 2013

Dear Catalog CEOs: More Valuable

Dear Catalog CEOs:

I've yet to meet a business leader who turns down customers who are "more valuable".


On the surface, we look at all of the channels in this image, and we think "if the customer touches more of them, then the customer must be more valuable."

Maybe.

Think, for a moment, about your relationship with your favorite restaurant.

I'll bet you have a favorite dish.  At one restaurant, I have to order calamari ... can't help myself!  And I'll cycle through main dishes, with two or three favorites, and others I'll enjoy on a whim.  My relationship is with the restaurant.  Each item on the menu is similar to a channel.  Each time I visit the restaurant, the odds of me trying something different increase.

This is where we get the relationship wrong.  A customer likes our brand.  The customer manifests this gratitude via channels.  We simply measure gratitude incorrectly.

Don't view channels as the end result.  The customer likes you, and one of the symptoms of gratitude is use of multiple channels.  You don't necessarily create gratitude by forcing the customer to use more channels.

Can You Believe It? It's Time, Again

Four months go by in the snap of a finger! It's time for yet another run of the MineThatData Elite Program. Cost is $1,800 for first-tim...