- "Nothing Compares 2 U" - Sinead O'Connor
- "Vogue" - Madonna
- "Ice Ice Baby" - Vanilla Ice
- "U Can't Touch This" - MC Hammer
- "It Must Have Been Love" - Roxette
Back in 1990, you didn't have a tool like Crazy Egg to help you visualize things. You had to write code.
Yes, I know. Technology makes things easier for folks, giving more people access to information. It's all good. I get it. But this is my blog, and I have a point to make!
There is something critically important about being able to write code. You are empowered to produce elegant work when you write code ... you are forced to do utilitarian (still highly important) work when you don't write code.
In 1990, I worked with several analytics co-workers.
Each and every one of my co-workers were smarter, more talented, and more recognized than I was.
It is not good to be at the bottom of the analyst ladder.
So I had to do something different. I had to do something to get noticed.
I decided to write code - I created a 3-D color contour plot (color was rare in 1990, FYI) using an HP7475a plotter. The map illustrated corn or sorghum hybrid yields in, say, Iowa, via color, in 3-D format --- it looked a little something like this:
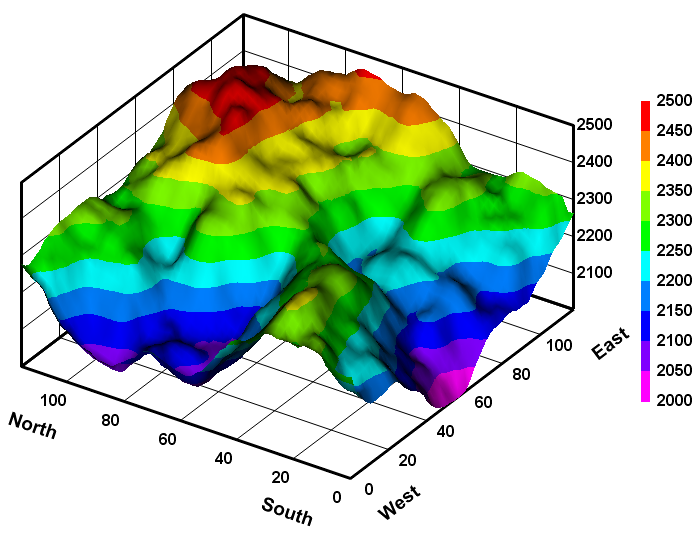
Instead of the graph looking like this - imagine state boundaries instead of the N/S and E/W axis on this graph. Make sense? I know, it's geeky.
This graph got attention. In fact, I was able to submit to the 1990 SUGI conference in Nashville, and present the methodology as a poster.
Click below to see the actual paper/poster and associated SAS code (which should still work, FYI). http://www.sascommunity.org/sugi/SUGI90/Sugi-90-195%20Hillstrom.pdf
When I applied for a job at Lands' End, in late September 1990, I provided a copy of the code, and a sample graph ... "Number of Junebugs Killed Daily on Wisconsin Highways". Though the folks at Lands' End had already chosen a candidate for a Statistical Analyst position, the graph got their attention ... enabling me to earn the opportunity to be hired at Lands' End.
If I don't take the initiative and write the code, I don't get invited to present the poster at SUGI 1990. And if I don't get invited to present the poster at SUGI 1990, I don't get hired by Lands' End. And if I don't get hired by the good folks at Lands' End, I don't get the opportunity to share information with you.
It is SOOOOO important to possess the skills to write just a little bit of code. So many analysts - maybe more than half these days, are web analysts who are not required to write code. This means that so many of today's analysts can only do what software developers want the analyst to do.
My entire career was launched by the ability to write code that created a 3-D contour plot.
Learn to write code. Your future career path depends upon it.

No comments:
Post a Comment
Note: Only a member of this blog may post a comment.