I have eight variables in this model ... weighted percentage of historical dollars spent in email, search, mobile, social, over the phone, and on your website. You get to choose the attribution model you want to use to assign weighted dollars to channels. There are two additional variables ... 1/0 variables for newbies and for loyalists.
With these variables, I use SPSS to run a factor analysis, after calculating means and standard deviations.
variable labels
ch01 'Phone'
ch02 'Web'
ch03 'Email'
ch04 'Search'
ch05 'Social'
ch06 'Mobile'
buy1 'Loyal'
buy2 'Newbie'.
execute.
DESCRIPTIVES
VARIABLES = ch01 ch02 ch03 ch04 ch05 ch06 buy1 buy2
/STATISTICS=MEAN STDDEV.
execute.
FACTOR
/VARIABLES
ch01 ch02 ch03 ch04 ch05 ch06 buy1 buy2
/MISSING LISTWISE
/ANALYSIS
ch01 ch02 ch03 ch04 ch05 ch06 buy1 buy2
/PRINT INITIAL ROTATION FSCORE
/CRITERIA FACTORS(02) ITERATE(200)
/EXTRACTION PC
/CRITERIA ITERATE(200)
/ROTATION VARIMAX
/METHOD=CORRELATION.
execute.
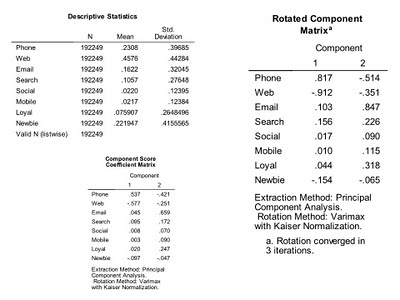
We run the code against the dataset, yielding the following output:
The component score coefficient matrix is important, because we multiply the coefficients in that table against standardized values for each variable, yielding the two factor scores that, when plotted, yield the Lifecycle Marketing and Touchpoints map at the start of this post.
I use the following SPSS code to score each factor.
compute st01 = (ch01 - 0.2308) / 0.3969.
compute st02 = (ch02 - 0.4576) / 0.4428.
compute st03 = (ch03 - 0.1622) / 0.3205.
compute st04 = (ch04 - 0.1057) / 0.2765.
compute st05 = (ch05 - 0.0220) / 0.1240.
compute st06 = (ch06 - 0.0217) / 0.1238.
compute by1 = (buy1 - 0.0759) / 0.2648.
compute by2 = (buy2 - 0.2219) / 0.4156.
compute f1 = 0.537*st01 - 0.577*st02 + 0.045*st03 + 0.095*st04 + 0.008*st05 + 0.003*st06 + 0.020*by1 - 0.097*by2.
compute f2 = -0.421*st01 - 0.251*st02 + 0.659*st03 + 0.172*st04 + 0.070*st05 + 0.090*st06 + 0.247*by1 - 0.047*by2.
execute.compute st02 = (ch02 - 0.4576) / 0.4428.
compute st03 = (ch03 - 0.1622) / 0.3205.
compute st04 = (ch04 - 0.1057) / 0.2765.
compute st05 = (ch05 - 0.0220) / 0.1240.
compute st06 = (ch06 - 0.0217) / 0.1238.
compute by1 = (buy1 - 0.0759) / 0.2648.
compute by2 = (buy2 - 0.2219) / 0.4156.
compute f1 = 0.537*st01 - 0.577*st02 + 0.045*st03 + 0.095*st04 + 0.008*st05 + 0.003*st06 + 0.020*by1 - 0.097*by2.
compute f2 = -0.421*st01 - 0.251*st02 + 0.659*st03 + 0.172*st04 + 0.070*st05 + 0.090*st06 + 0.247*by1 - 0.047*by2.
At this point, each customer has a score for each factor.
The map shows where customers fall on the two axes represented by each factor.
In the next post, we'll talk about the meaning of this plot.


No comments:
Post a Comment
Note: Only a member of this blog may post a comment.