Here's our table.
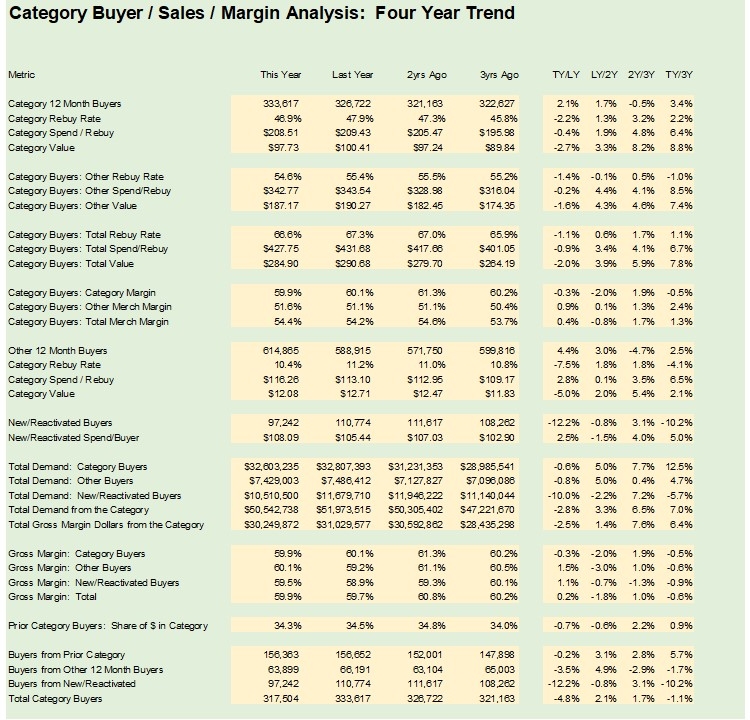
Let's look at repurchase rates. At the top of the table we have rebuy rates within the category for customers who bought from the category in the past year.
- 47% This Year.
- 48% Last Year.
- 47% 2 Years Ago.
- 46% 3 Years Ago.
This is good news. Customers who bought from this category last year have nearly a 50% chance of buying from the category again next year.
How about all of the remaining 12 month buyers - those customers who haven't bought from the category in the past year but bought other merchandise?
- 10% This Year.
- 11% Last Year.
- 11% 2 Years Ago.
- 11% 3 Years Ago.
In other words, if you bought from the category last year you are 4 times a likely to buy again next year as are customers who haven't bought from the category in the past year but purchased in the past year.
At the bottom of the table we can see where all of the customers who bought from the category came from.
- 156,363 came from category buyers from last year.
- 63,899 came from non-category buyers who purchased in the past year.
- 97,242 came from new/reactivated buyers.
- 317,504 buyers in total.
We can also see where demand/sales came from.
- $32.6 million came from category buyers from last year.
- $7.4 million came from non-category buyers who purchased in the past year.
- $10.5 million came from new/reactivated buyers.
- $50.5 million in total.
We'll explore more aspects of this table tomorrow. And in a few days I'll show you a category that is struggling, and fully dependent upon the rest of the business for existence.

No comments:
Post a Comment
Note: Only a member of this blog may post a comment.