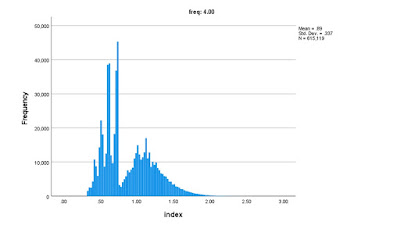
I took twelve-month buyers who purchased exactly four times, historically. I built a model to predict how likely the customers were to purchase again next year. Twelve months later, I applied the same model to customers, based on their current status. Finally, I divided the "next year" prediction by the prediction "one year ago", giving me a performance index.
Below is a histogram of the performance index. Tell me what you observe.
There are two peaks, aren't there?
There is a peak at about 0.60 ... meaning that one group of customers saw their chances of purchasing again slump by about 40%. These customers (obviously) did not purchase in the past year.
There is another peak, at about 1.20 ... meaning that another group of customers saw their chances of purchasing again increase by about 20%. These customers (obviously) purchased again the past year. Most of those customers became more valuable.
The average index for 4x buyers is (in this case) 0.89, meaning that on average this cohort of buyers saw their future chances of buying again slump by about 11%. The cohort (on average) becomes less valuable, with some customers becoming more valuable.
What was the index by 12 month buyer x frequency segment?
- 1x Buyers = 0.75.
- 2x Buyers = 0.83.
- 3x Buyers = 0.86.
- 4x Buyers = 0.89.
- 5x Buyers = 0.90.
- 6x-10x Buyers = 0.92.
- 11x-15x Buyers = 0.94.
- 16x-25x Buyers = 0.97.
- 26x+ Buyers = 1.00.


No comments:
Post a Comment
Note: Only a member of this blog may post a comment.