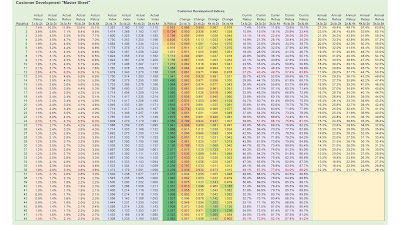
The biggest prize in any Customer Development Project is the presentation of what I call the "Master Sheet".
Yeah, there's a ton of numbers in the Master Sheet. All of those numbers tell the story of how well you Develop Customers.
The Master Sheet is divided into five unique tables, five stories, by months since last purchase. We have incremental repurchase rates by recency, we have indices that tell us how much response increases as we move from a 1st to a 2nd to a 3rd to a 4th to a 5th to a 6th purchase. The indices are important, because I compare your indices against a family of brands, so that you can see how you "stack up" against the competition ... that's the middle of the table. In the middle of the table, I compare your 1x to 2x rebuy rates against the competition, and I compare the rate of growth in response for 2x / 3x / 4x / 5x buyers against the competition. Notice the colors in the middle of the Master Sheet. Greens are above-average (vs. competition), yellows are average, red/orange are below-average. This tells you how you stack up. Finally, I list cumulative repurchase rates after a purchase by months since that purchase, and then the yellow columns at the end of the table show us twelve-month rebuy rates at "recency = x" months.
Combine all of this data in the "Master Sheet", and we have the story of your Customer Development efforts!
More on the topic tomorrow. When you need to hire me to understand how your Customer Development efforts stack up, email me here (kevinh@minethatdata.com) and click here for project pricing.


No comments:
Post a Comment
Note: Only a member of this blog may post a comment.