 There are two directions that the world is heading in.
The first direction is being taken by the customer. Twenty years ago, she was one of a million similar customers. Today, she is going in a million different directions, using search and mobile and traditional media and social media to do whatever she wants, whenever she wants.
The second direction is being taken by the vendor community. The vendor community is telling us that we need to take a million customers moving in a million different directions, and herd them in a brand-friendly direction with integrated data from all sources.
This message is coming from a lot of different disciplines, and the message is typically prescribed to us when a disruptive technology displaces an incumbant technology. Long-time blog readers know that the catalog industry went through this in the first half of the decade, as e-commerce displaced catalog marketing.
Now we see e-mail being displaced by social media, we see Web Analytics and Business Intelligence racing to the middle ground of multichannel database support and analytics, and we see online folks promoting mobile marketing as part of an integrated e-commerce strategy.
In 2015, e-commerce gurus will tell us how e-commerce is a vital part of a multichannel hologram marketing strategy. It's simply the way that humans deal with technological transformation.
The challenge, of course, is to go beyond the message.
We need to find a middle ground, one of data integration and customer understanding, one that does not necessarily support campaign integration that does not yield increased profit or increased annual retention rates.
Of course, knowledge about integrated data existed since the days of Snedecor and Cochrane, if not earlier. Statisticians have always used a measure called "R-Squared" to explain how much of the variability in a dataset is explained by different combinations of variables.
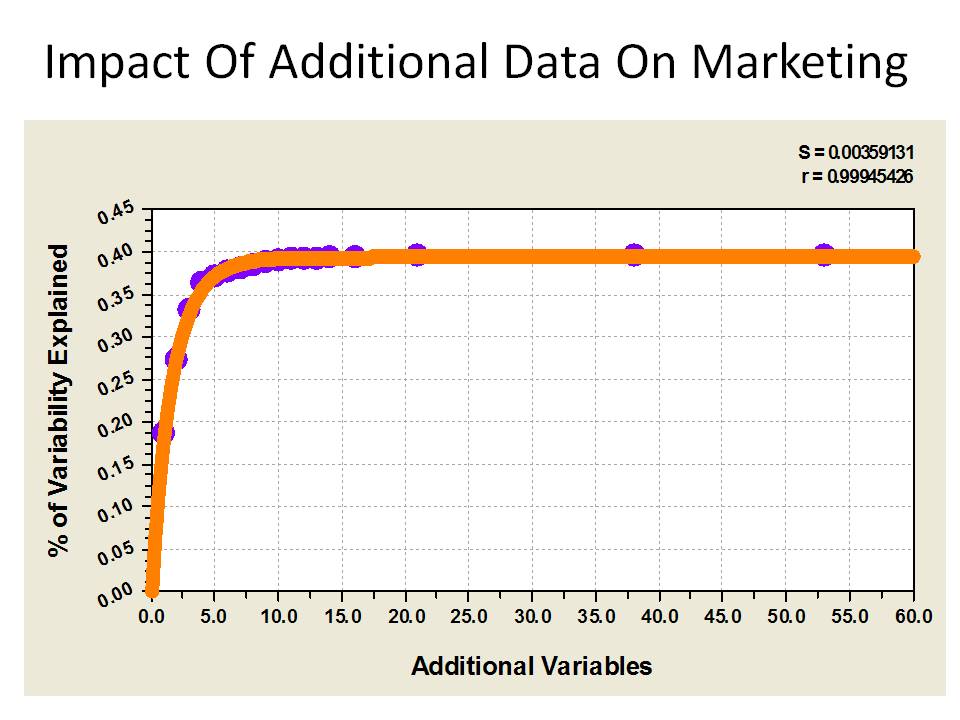
The graph at the top of this post is the result of a model that ranks customers from best to worst, based on integrated data across channels. The x-axis represents each variable added to the model, the y-axis represents the percentage of variability explained by the variables in the model. This model was built off of actual multi-channel customer data.
Notice that when you add the first piece of data, you make a huge leap. Then you add a second piece of data, and you make a smaller leap.
After adding the fifth piece of data (i.e. channel), you stop making significant improvements. In other words, you're just as well off with five pieces of customer information as you are with fifty pieces of customer information. This concept is known as "parsimony", or "less is better".
This is the piece of the puzzle that isn't always explained.
The reality is that, by having a few key data points from each channel, you get 98% of the benefit from 10% of the work.
Focus on getting a few key data points from each of your channels, and focus on how your organization can make decisions on a small number of customer attributes. You'll find it is a lot harder to get people to work together than it is to integrate data ... and you'll find that nobody has a solution for getting people to work together!

No comments:
Post a Comment
Note: Only a member of this blog may post a comment.